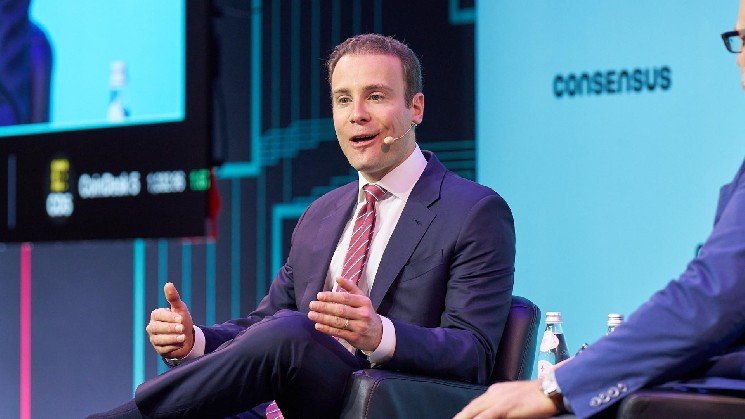
“To achieve this, I’ve directed the CFTC staff to begin exploring rules to codify a CFTC market structure for crypto assets using the agency’s existing authorities,” Selig said, promising the agency will be in a position to move swiftly. And he said he’s also steered staff toward work with developers to build regulations to “offer their protocols in a legal and compliant manner in the United States, future-proofing developer protections once and for all.”
The CFTC’s sister agency, the Securities and Exchange Commission, just this week proposed its first major crypto rule, known as Regulation Crypto Assets, to allow crypto startups and fundraising with fewer regulatory hurdles. And the two agencies had previously jointly issued a policy stance defining the different kinds of digital assets and what regulatory buckets they should fall into, though it wasn’t set as a formal rule.
But SEC Chair Paul Atkins was quick to point out at an event with President Donald Trump on Wednesday that “the most important priority is for Congress to send the Clarity Act to your desk for your signature,” and he’s routinely argued that the new law would be the way to assure permanence for crypto policy.
The CFTC chief agreed on Thursday, saying, “Passing Clarity is the surest way that we can prevent another Gary Gensler from running a rogue campaign of lawfare against the individuals and companies in this room today.”
Coldcard has released a new firmware update to enhance the security of its hardware wallets. The company stated that some recovery phrases created in previous software versions may pose a potential security risk, and advised affected users to create a new recovery phrase and transfer their assets to the new wallet.
As you know, a security vulnerability in the Coldcard hardware wallet recently resulted in the theft of over $70 million worth of Bitcoin from users’ wallets.
Coldcard has released version 5.6.1 for the Mk4 and Mk5 models, and 1.5.1Q for the Q model. The update is the result of a comprehensive security review lasting approximately three weeks, following the emergency security patch released on July 31st.
With the new firmware, every new recovery string created on Coldcard devices must now include at least one user-provided source of physical entropy.
Users will be able to do this using one of the following options: at least 65 irregular keystrokes, 50 physical dice rolls, or 128 physical coin tosses.
This user-generated randomness will be combined with new entropy derived from the device’s STM32 TRNG hardware and the SE1 and SE2 secure elements. Coldcard stated that this change aims to make the recovery string generation process more resilient to potential attacks.
The update doesn’t just change how recovery statements are generated. The new version also enables real-time and incremental PSBT verification before the signing process.
In addition, security measures for USB connections and firmware update processes have been strengthened, and the Delta Mode isolation mechanism has been improved.
The update addresses several issues related to backing up active wallets, while also implementing more robust random number generators and making error checks more rigorous. Various security and accuracy improvements are included in the update, along with changes to the SIGHASH defaults.
The most important warning in Coldcard’s announcement concerns the current recovery statements.
The company specifically emphasized that installing the new firmware does not eliminate a potential security issue in recovery strings created using previously affected software versions.
Users affected by the security alert must first update their devices to the new firmware version, then create and verify an entirely new recovery string, and transfer their existing Bitcoin assets to the newly created wallet.
Coldcard also strongly advised all Mk4, Mk5, and Q users to update their devices as soon as possible and verify the digital signature of the downloaded firmware file.
Bitcoin ($BTC), with its recent accelerated rise, is approaching the “golden cross” pattern, which is considered one of the key indicators of long-term bullish momentum in technical analysis.
Bitcoin’s price surged above $72,000, with gains exceeding 12% in the past week. This rise also pushed $BTC above its 200-day simple moving average (SMA), currently standing at $69,005.
Critical Threshold for Golden Cross in Bitcoin
A golden cross occurs when a shorter-term moving average crosses a longer-term moving average from below to above. For Bitcoin, the key indicators followed by the markets are the 50-day and 200-day moving averages.
If $BTC continues its upward trend and the 50-day SMA crosses above the 200-day SMA, a golden cross pattern will officially form. In technical analysis, this crossover is generally considered a signal that the long-term uptrend is strengthening.
The fact that Bitcoin is currently trading slightly above its 200-day SMA is also a noteworthy development for the market.
Why is the 200-Day Average Important?
The 200-day SMA (Short-Motion Moving Average) shows the average of Bitcoin’s closing prices over the last 200 trading days and is among the most closely followed technical indicators for determining the long-term direction of the market.
Bitcoin remaining above its 200-day moving average for an extended period can be interpreted as a sign that the overall market structure may shift from a bearish to an bullish trend. Conversely, a drop back below this level could signal a weakening of the bullish momentum.
Coinbase CEO Brian Armstrong stated that Bitcoin ($BTC) could experience a strong upward trend in the coming years, adding that reaching the $300,000 to $400,000 range by 2030 is “very likely.”
Appearing on the Varney & Co. program on Fox Business Network, Armstrong shared his long-term expectations regarding the price of Bitcoin, while also drawing attention to recent developments in cryptocurrency regulation in the US.
Armstrong stated, “Looking ahead to the next few years, say by 2030, I think it’s very likely we’ll see Bitcoin at the $300,000 and $400,000 levels. We’ll see how it progresses after that.”
Bitcoin surged sharply, surpassing the $72,000 level, in the period following Armstrong’s statements. $BTC’s gains in the last 24 hours approached 10%, and market activity accelerated with the crypto-friendly statements from Washington.
Armstrong: There’s a Great Sense of Urgency in the Trump Administration
Coinbase CEO stated that he also attended a meeting held by US President Donald Trump at the White House on Wednesday with high-ranking figures from the cryptocurrency and traditional finance sectors.
According to Armstrong, one of the most important items on the meeting’s agenda was the long-debated CLARITY Act.
Armstrong said the following regarding the matter:
“Just yesterday, the chairman had a meeting with top regulators from the SEC and the CFTC. This was the main topic of discussion. There was a strong sense of urgency within this administration: to complete and enact CLARITY.”
Following the meeting, Trump also called on Congress to move forward with the Clarity Act, describing the legislation as a “very, very powerful” piece of law.
The bill, which was previously expected to be voted on in August, is now expected to be put to a vote in September following the delay.
The long-awaited CLARITY Act aims to create a comprehensive regulatory framework in the US that determines under what conditions digital assets are classified as securities, commodities, or stablecoins used for payment purposes.
The cryptocurrency sector has argued for years that the legal status of digital assets in the US needs to be more clearly defined. If the bill becomes law, it is expected that the jurisdiction of regulatory bodies such as the SEC and CFTC in the crypto market will also become clearer.
However, the CLARITY Act struggled to progress throughout much of 2026 due to ongoing debates between the banking sector and crypto companies regarding stablecoin yields.
Some banks have warned that crypto companies offering high returns to stablecoin holders could lead to a shift of deposits from traditional banks to crypto platforms.
Armstrong, however, said that not the entire banking sector was opposed to the bill.
The Coinbase CEO said, “There are actually many banks that have stated their support for the CLARITY Act. Most banks acknowledge that it gives them new powers and allows them to grow their businesses thanks to this new technology. That’s great. However, I can say that there are still a few banks that oppose it.”
Hudson River Trading signed a multiyear agreement worth billions of dollars with CoreWeave to expand the computing infrastructure used for its trading research and models.
The agreement builds on an existing partnership between the companies and represents a material expansion of their relationship, CoreWeave Chief Revenue Officer Jon Jones told Bloomberg. He declined to disclose specific financial terms.
As part of the deal, HRT will become one of the first CoreWeave customers to receive wide scale access to Nvidia’s newest Vera Rubin AI chips.
HRT, one of the largest nonbank trading firms in the US, has been increasing its use of specialized cloud providers such as CoreWeave as its research requires greater computing capacity. Additional processing power allows researchers to test more models and evaluate trading strategies across a wider range of markets and time horizons.
Kevin Lee, head of research and development at HRT, said greater access to computing resources lets the firm’s researchers run more experiments and potentially identify new trading opportunities. He also said CoreWeave had performed well in delivering infrastructure on schedule and operating Nvidia hardware efficiently.
The deal further expands CoreWeave’s customer base as the company works to reduce its historical dependence on Microsoft and increase its exposure to financial services customers. HRT became a CoreWeave customer in March.
CoreWeave highlighted its growing relationship with HRT in its second quarter earnings report last week as it pushes further into financial services alongside its existing technology and AI customers.
Jane Street, one of HRT’s largest competitors, has also expanded its relationship with CoreWeave. The trading firm previously agreed to spend $6 billion on CoreWeave data center capacity and invested $1 billion in the cloud infrastructure provider.
CoreWeave has also raised billions of dollars in debt to finance additional computing capacity tied to demand from customers including HRT and Jane Street.
Jones said financial firms are increasingly adopting the same advanced computing infrastructure used by developers of frontier AI models as trading companies expand their use of artificial intelligence and large scale computing.
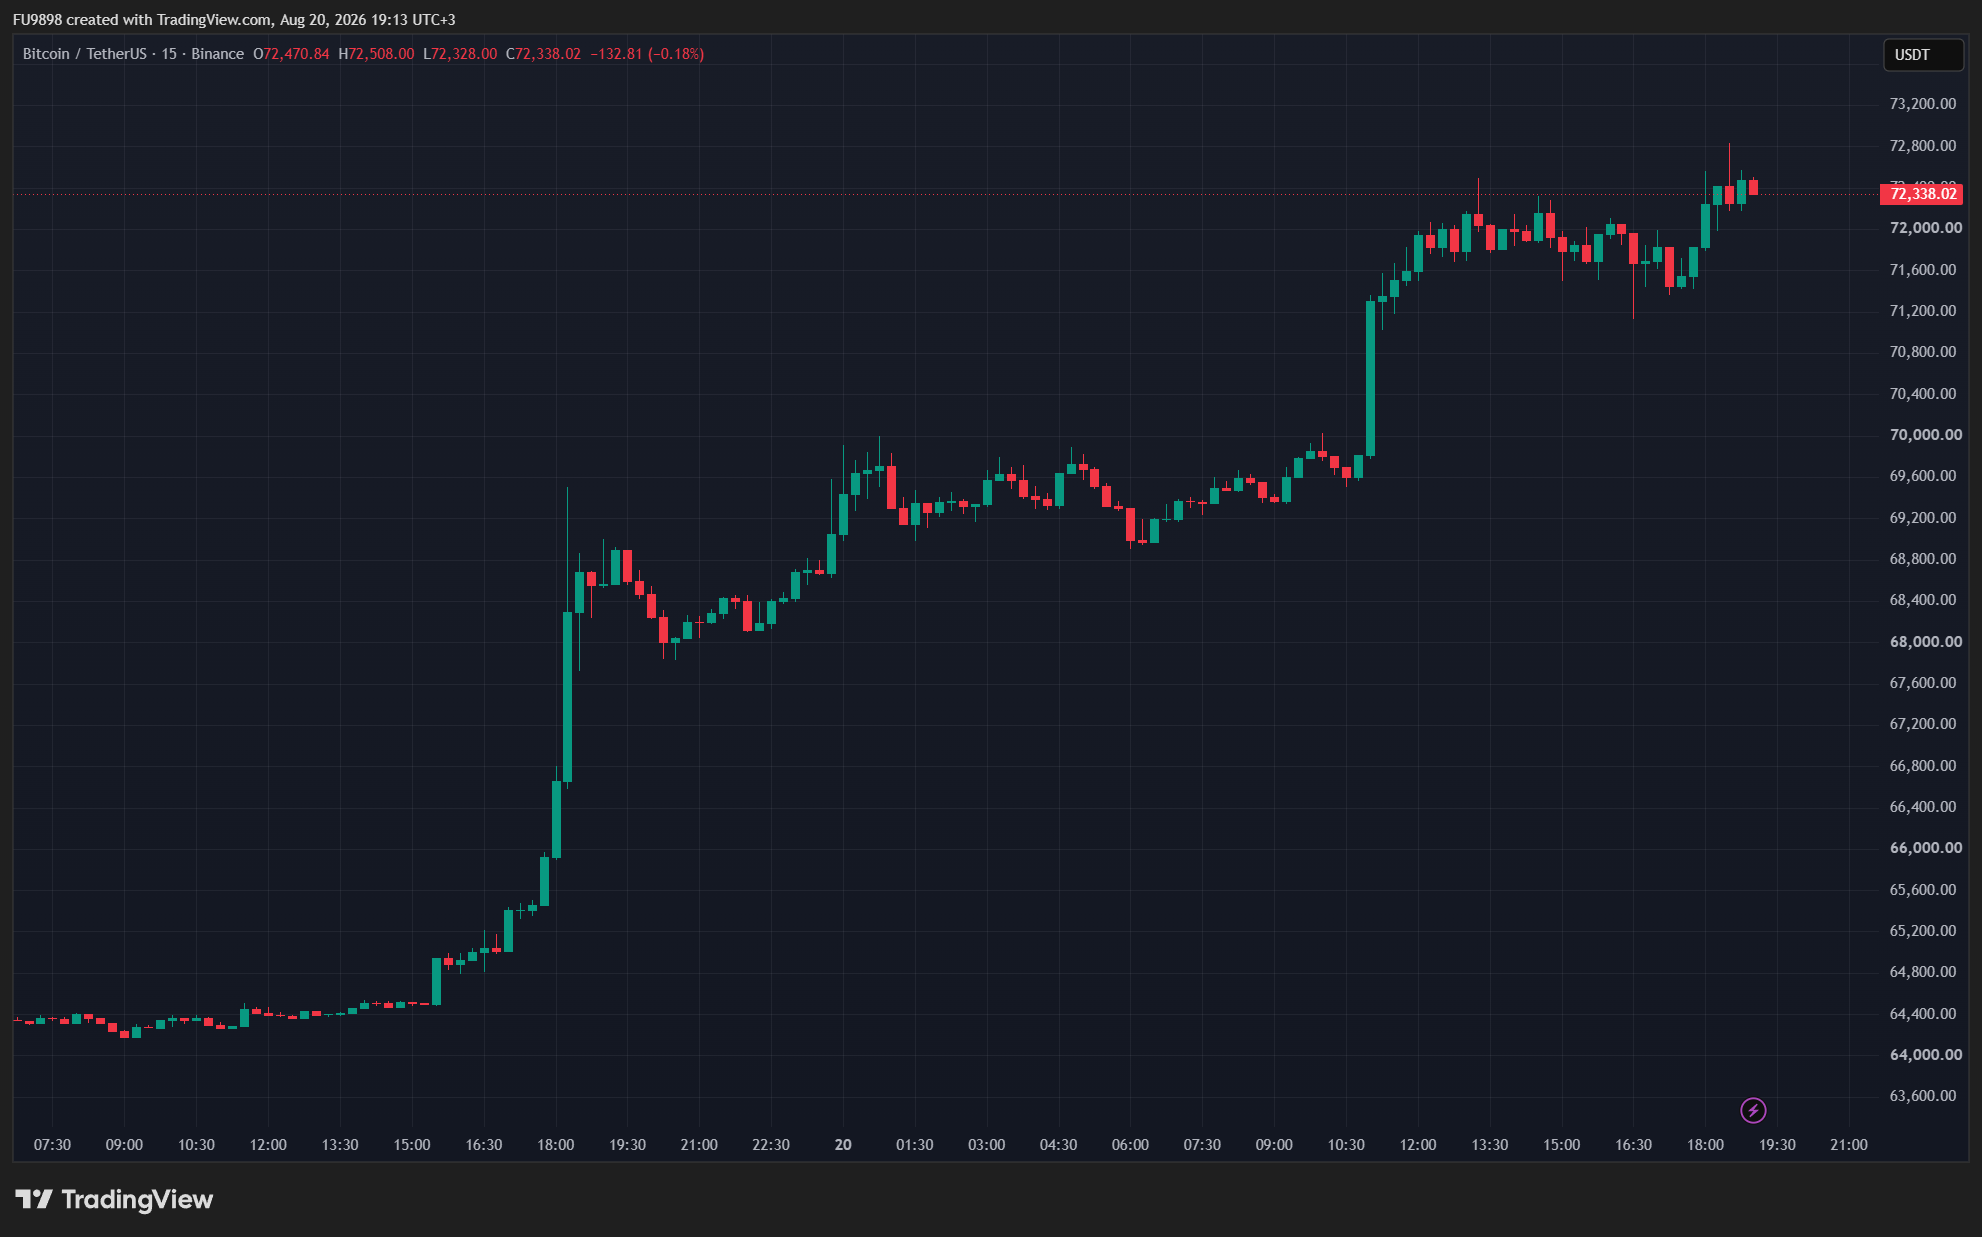
Bitcoin surged a second time today, surpassing $72,000 and reaching its highest level since June, following yesterday’s sharp rise. According to Binance data, $BTC climbed as high as $72,830 during the day, and is currently trading around $72,500 at the time of writing.
A chart showing the increase in $BTC price.
The rise in the cryptocurrency market is believed to be driven by two significant developments from the US. The first catalyst was the US Treasury Department’s announcement that it will at least double the size of its repurchase operations for long-term government bonds.
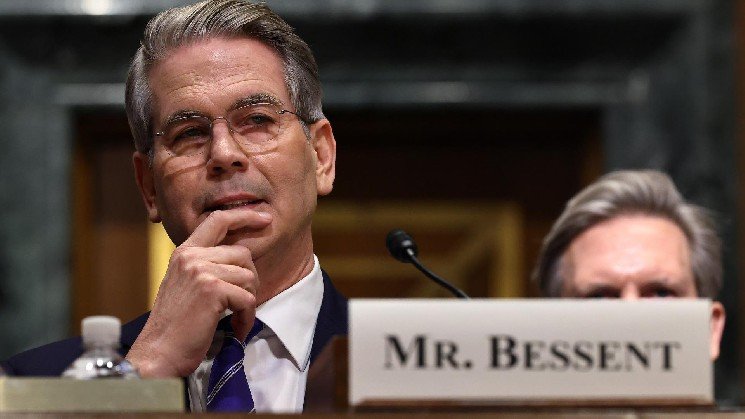
Under the new plan, the maximum size of buyback operations for 10-20 year and 20-30 year bonds is planned to be increased from $2 billion per transaction to at least $4 billion.
Following the decision, the US 30-year Treasury yield, which had previously climbed to 5.337%, its highest level since 2007, fell sharply. The decline in long-term bond yields increased the relative attractiveness of alternative assets like Bitcoin, which does not provide yield, and $BTC was one of the first assets to react strongly to the news.
Crypto Meeting at the White House Boosts Bitcoin Once Again
The second wave of Bitcoin’s rise occurred following new news from Washington.
US President Donald Trump reportedly met with representatives of the cryptocurrency industry, including executives from Coinbase, Payward, and Blockchain.com, at the White House.
During the meeting, Trump reportedly mentioned the possibility of the US purchasing a “significant amount” of Bitcoin and urged Congress to pass the CLARITY Act before the critical September 15 deadline.
These statements quickly triggered a new wave of buying in Bitcoin. $BTC rapidly rose from around $69,000 to over $71,000, continuing its upward trend and reaching $72,830.
$1.54 Billion Worth of Short Positions Liquidated While Bitcoin Rises
The sudden surge in Bitcoin and Ethereum also led to large-scale liquidations in leveraged markets.
In the last 24 hours, a total of $1.76 billion in leveraged positions were liquidated in the cryptocurrency market, with $1.54 billion of this amount consisting of short positions. The amount of long positions liquidated was recorded as $219.52 million.
In the last 12 hours, $512.81 million worth of short positions were liquidated, bringing the total liquidation to $612.17 million. In the last four hours alone, $96.75 million worth of short positions were eliminated from the market.
In the most recent one-hour period, a total of $55.24 million in liquidations occurred, with $50.72 million of that coming from investors who took short positions.
With the rise in $BTC and ETH prices, the dollar-denominated value of open positions in the futures markets has also increased significantly.
However, data indicates that approximately 90 percent of the increase in open positions is due not to the entry of entirely new leveraged positions into the market, but rather to the appreciation of existing positions in dollar terms as a result of rising Bitcoin and Ethereum prices.
This suggests that growth in derivatives markets may not represent as large an influx of new speculative capital as it initially appears.
That matters for bitcoin because high Treasury yields can pull capital toward government bonds and away from risk assets. Buybacks can support bond prices and help contain yields, potentially removing some of that pressure.
Connors said the initial purchases remain small but he expects Treasury support could eventually reach between $10 billion and $30 billion a month, far beyond the $4 billion announced by Bessent.
The move has also changed his outlook for bitcoin. Connors had expected $BTC to remain subdued until November as it followed its traditional four-year cycle. He is now less certain that investors will have to wait that long.
He believes another potential step could involve changes to the supplementary leverage ratio, or SLR, which affects how much Treasury debt banks can hold relative to their capital. Easing those constraints could give banks more room to absorb government bonds.
“When that happens, that’s when bitcoin starts to seek that first $180,000 price threshold,” Connors said. His target range for the cycle through 2030 is $180,000 to $360,000.
In the immediate term, $72,000 could carry added significance because of how crypto traders are positioned.
Charles Schwab director of crypto research Jim Ferraioli said earlier modeling showed a large concentration of leveraged bitcoin shorts around $72,000.
$XRP has embarked on an impressive recovery push, but it must first close above the 20- and 50-week EMAs to confirm a bullish breakout.
The broader crypto market has seen renewed buying pressure, with the global crypto market (TOTAL) adding over $229 billion in less than two days. As a result, the global crypto market cap has recently hit a 3-month peak of $2.42 trillion.
$XRP has since taken advantage of this upward push, posting its own gains and outperforming the broader market.After starting the week slow, $XRP has turned its fortunes around, up 20% this week at press time.
However, market data indicates that $XRP remains in a bearish position despite the recent rebound surge. Essentially, the crypto asset still has multiple roadblocks to conquer before it can confirm a shift in market structure from bearish to bullish.
$XRP Must Close Above Key Weekly EMAs
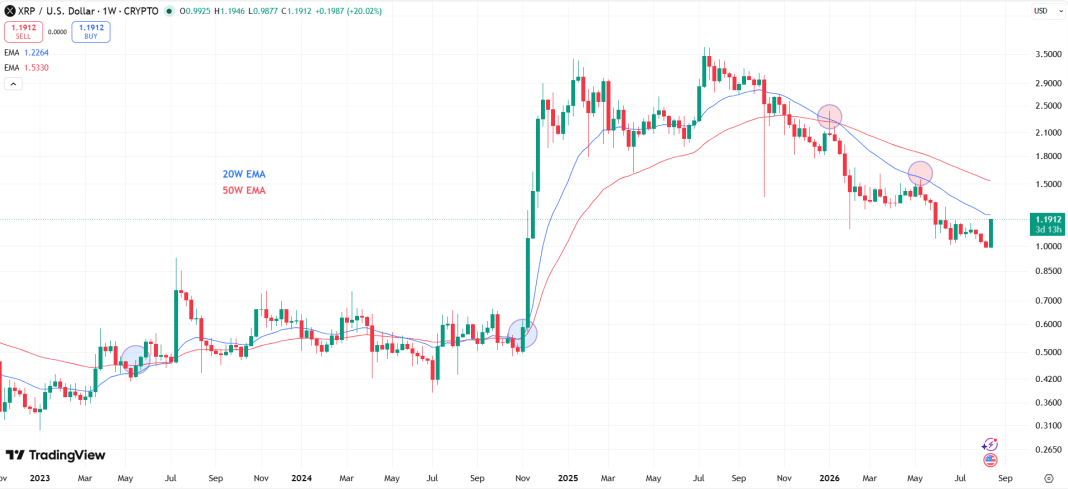
Two of these roadblocks involve the 20-week and 50-week exponential moving averages (EMAs). While $XRP has gained more than 20% since the start of the week, its price at $1.1912 remains below these two moving averages, confirming that bears still maintain control in the mid-term.
At press time, the 20-week EMA stands at $1.2264, while the 50-week EMA holds around $1.5330. The last time $XRP traded around the $1.22 region was in mid-June, during a drop from a $1.29 high. Meanwhile, the token last saw $1.53 in May, three months ago.
Historical data shows that $XRP must first close a weekly candlestick above these EMAs before the market can confirm a bullish shift. Notably, previous price surges have always occurred on the back of a close above these moving averages.
For instance, in 2023, $XRPwas able to flip its momentum bullish after prices closed above the 20 and 50-week EMAs in May. After this, $XRP saw a dramatic surge from $0.42 to $0.92 by July 2023, marking a 119% price increase within weeks.
Key $XRP EMAs
A similar pattern played out in Q4 2024. Specifically, after $XRP closed above the 20-week and 50-week EMAs in early November 2024, the next week brought a massive 79% surge amid President Donald Trump’s election victory. This led to the bull run that pushed $XRP’s price from $0.5 to $3.4 by January 2025.
The Journey is Tough
However, breaking and eventually closing above these moving averages may not be an easy task for $XRP. Since losing these levels, the altcoin has made several attempts to push above them, but each attempt met stiff resistance from sellers.
When $XRP dropped below the 20-week EMA in October 2025, it immediately pushed to recover it four weeks later, but the asset faced resistance at $2.37 and eventually pulled back.
Also, after losing the 50-week EMA in November 2025, $XRP attempted to reclaim it during the January 2026 rebound push, but it witnessed another roadblock at $2.41 before dropping below $2 again.Another attempt in May 2026 faced resistance at $1.54, leading to another drop.
From the current price of $1.1912, $XRP would need only an additional 2.95% rise to push above the 20-week EMA. Meanwhile, the crypto asset would have to surge by a more substantial 29% to reclaim the 50-week EMA, making the journey to these levels a tough one.
The crypto market suddenly sprang back to life, sending Bitcoin and the majority of crypto assets, including Dogecoin, higher.
At the time of writing, Dogecoin was trading up 10% at $0.0771, extending yesterday’s surge from a low of $0.069. The dog-themed coin briefly touched an intraday high of $0.078 early Thursday before retreating slightly.
In his characteristic manner, Dogecoin cofounder Billy Markus, who goes by Shibetoshi Nakamoto on X, commented on the crypto market surge in a social media post.
Markus shared a screenshot that showed the surge, with most assets in the green, and asked two questions that had several question marks interspersed with exclamation marks: “is crypto back? is the 2026 nightmare over?” The question “is the 2026 nightmare over?” highlights the uncertainty in the crypto market following a difficult period in 2026.
is crypto back!?!?!?!?!
is the 2026 nightmare over?!?!!? pic.twitter.com/UoMYlciTwc
— Shibetoshi Nakamoto (@BillyM2k) August 19, 2026
Cryptocurrencies had seen months of selling since last October when a major flash crash liquidated a record $19 billion in the market.
Is crypto back?
Markus’s screenshot showed the rise of various assets including BTC, S&P 500, Ethereum, Solana, and Dogecoin. Notably, the mentioned crypto assets outperformed the S&P 500, which was only up 0.21% in the timeframe according to the screenshot.
In the financial markets, traders are digesting the latest Federal Open Market Committee minutes from July, released Wednesday, which seemed to offer less help to the bulls. Most officials backed keeping rates unchanged at the Fed’s July meeting, but several favored a hike.
This might have somewhat contributed to the minor gains in the S&P 500, with cryptocurrencies outperforming. This background might have prompted the Dogecoin cofounder to ask whether crypto was back.
The two questions from Dogecoin’s cofounder: “is crypto back? is the 2026 nightmare over?”cannot be fully answered unless a sustained rally is confirmed in the crypto market in the coming weeks and months.
As of August 20, 2026, the $XRP crypto market is running hot after a sharp push to $1.19. Every timeframe from daily to 15-minute is flashing overbought readings, while total crypto market capitalization sits near $2.45 trillion, up 7.29% in 24 hours.
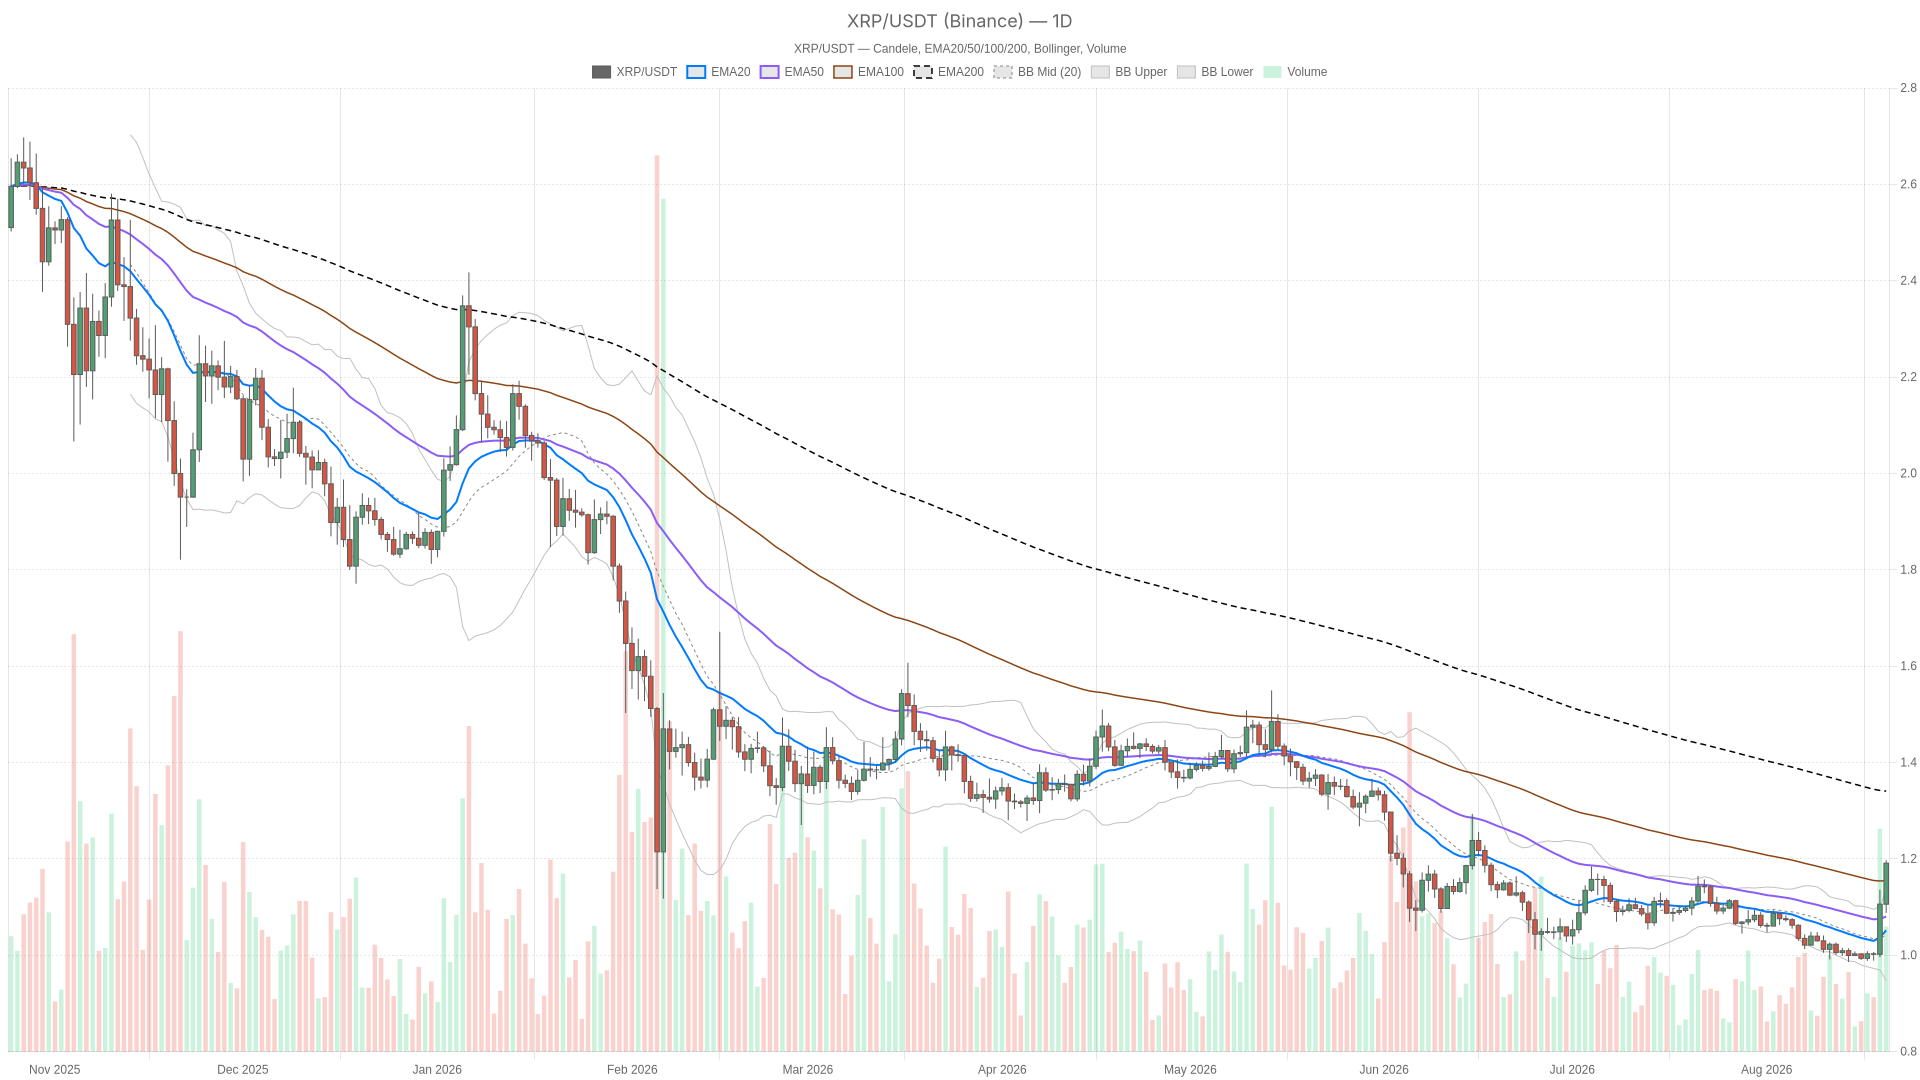
$XRP/USDT — daily chart with candlesticks, EMA20/EMA50 and volume.
Key takeaways
$XRP rallied to $1.19 on August 20, 2026, with the daily RSI at 72.39 in overbought territory.
Total crypto market capitalization reached near $2.45 trillion, up 7.29% in 24 hours, according to CoinGecko.
Bitcoin dominance sits at 58.7%, while $XRP represents roughly 3% of the total crypto market cap.
Price trades above the 20-day EMA at 1.05 and 50-day EMA at 1.08 but below the 200-day EMA at 1.34.
Hourly RSI reached 82.44, and the 15-minute MACD histogram flattened to 0.00.
Daily Chart: The Macro Bias Behind the $XRP Trend
The daily chart still reads as neutral, not bullish, because the rally has not cleared the long-term trend structure. $XRP closed at $1.19 with an RSI14 of 72.39, which places price firmly in overbought territory and usually precedes at least a pause, even in strong trends.
The MACD line sits at 0.00 against a signal line of -0.02, producing a modest positive histogram of 0.02. That marks a fresh, early-stage bullish cross rather than a confirmed one, so the daily momentum shift is real but still young.
The EMA structure deserves the most attention. Price is trading above both the 20-day EMA (1.05) and the 50-day EMA (1.08), which looks constructive on the surface. However, the 200-day EMA sits at 1.34, well above the current price.
That gap matters: $XRP is still technically below its long-term average, so this rally is happening inside a broader corrective structure rather than confirming a fresh long-term uptrend. This is why the system classifies the daily regime as neutral rather than bullish. The short-term momentum is up, but the bigger picture has not flipped yet.
The Bollinger Bands reinforce the idea of an overheated near-term move. With the daily mid-band at 1.04 and the upper band at 1.14, a close at 1.19 means price is trading noticeably above its own upper band. That stretched condition often resolves through a sharp pullback toward the band or through sideways consolidation while the bands catch up.
Daily ATR14 of 0.04 confirms volatility has expanded meaningfully alongside the move. On the pivot framework, price has already cleared the daily pivot point at 1.16 and is pressing toward R1 at 1.23. Meanwhile, S1 sits at 1.12 as the first line of defense if momentum fades.
1-Hour Chart: Confirmation, But Momentum Is Thinning
The hourly chart remains unambiguously bullish in regime, and its EMA stack confirms that bias cleanly. The 20-EMA (1.12) sits above the 50-EMA (1.07), which sits above the 200-EMA (1.03) — a textbook bullish alignment.
However, the RSI14 here is at 82.44, an extreme reading that is hard to sustain for long without at least a cooling-off period. The MACD is positive (0.04 line vs 0.03 signal), but the histogram has narrowed to just 0.01. That suggests the thrust behind this move is losing a bit of steam even as price holds up.
The clearest warning sign on this timeframe is the Bollinger Band setup: the hourly close of 1.19 is sitting right at the upper band, also 1.19. Price is glued to the ceiling of its own volatility envelope. The pivot point is at 1.19, R1 at just 1.20, and S1 at 1.18. That is an unusually tight range with little room before either a breakout attempt or a rejection becomes obvious.
15-Minute Chart: Execution Context
The 15-minute chart holds a bullish regime, and the EMA stack (20 at 1.16, 50 at 1.13, 200 at 1.07) is properly aligned for continuation. RSI14 at 76.28 is still hot, though marginally less extreme than the hourly reading.
However, what stands out is the MACD histogram flattening out to 0.00. Momentum on this execution timeframe has essentially stalled even though price has not dropped. That kind of quiet deceleration often shows up just before a decision point, whether that decision resolves higher or lower.
Bullish Scenario
The bullish case holds as long as buyers can defend the hourly pivot near 1.19 and push decisively through the 1.20 level. If price breaks and holds above the daily Bollinger upper band at 1.14, then continues past 1.20, the short-term uptrend stays intact. That would put real pressure on sellers, especially with the broader market backdrop still constructive after the 7.29% 24-hour gain in total market cap.
Moreover, the path toward the daily R1 at 1.23 opens up if the 1.20 level breaks decisively. This scenario would break if price fails to hold above the daily pivot at 1.16 or slips back under the hourly EMA20 at 1.12. Either would signal the bounce is running out of fuel.
Bearish / Mean-Reversion Scenario
The case for a pullback is arguably just as strong right now. With daily RSI at 72.39, hourly RSI at 82.44, and price trading well above the daily upper Bollinger Band, $XRP is overbought across essentially every relevant timeframe simultaneously. That condition historically invites mean reversion.
In addition, the flattening MACD histogram on the 15-minute chart and the thin 0.01 histogram make the momentum picture look tired, even if price has not cracked yet. A retracement toward the daily EMA20 at 1.05, or at least back to the pivot support at 1.12, would not be surprising. That move becomes more likely if buyers cannot sustain the current pace.
Moreover, it is worth remembering that the daily EMA200 sits up at 1.34. Spot price remains below that long-term average, so the primary trend by that measure has not technically turned bullish yet. That keeps a defensive read on the table.
This bearish and mean-reversion case would fail if price reclaims and holds above the daily EMA200 at 1.34. That would represent a genuine structural shift rather than a short-term bounce.
Positioning and Risk
The Fear & Greed Index reads 62, in “Greed” territory, which lines up with what the charts are showing. Sentiment has gotten ahead of itself just as $XRP pushes into stretched technical conditions. That combination does not necessarily mean a reversal is imminent, but it does mean volatility risk is elevated in both directions.
Daily ATR14 at 0.04 versus hourly ATR14 at 0.02 shows how much the intraday range has compressed relative to the daily swing. That gap tends to close abruptly rather than gradually. For anyone tracking $XRP crypto right now, the honest read is that the trend is up and the momentum is real.
Still, the multi-timeframe overbought stack and the daily price sitting below its own 200 EMA mean multiple angles are testing this rally at once. This is a market that rewards patience over conviction until one of these tensions resolves.
FAQ
Is $XRP overbought on the daily chart?
Yes. The daily RSI14 sits at 72.39, which places $XRP in overbought territory after the close at $1.19.
What is the key resistance level for $XRP right now?
The immediate focus is the 1.20 level, with the daily R1 at 1.23 as the next target if buyers can push through.
Where could $XRP pull back if momentum fades?
A retracement toward the daily EMA20 at 1.05, or at least back to the pivot support at 1.12, would not be surprising if buyers lose pace.
Disclaimer: This article is for informational purposes only and does not constitute financial advice, an investment recommendation, or a solicitation to buy or sell any financial instrument or cryptocurrency. The analysis provided is not indicative of future results. Investing in crypto assets and financial markets carries a high risk of capital loss. Always do your own research (DYOR) and consult a qualified financial advisor before making any decision.
Article produced with the assistance of artificial intelligence and reviewed by the editorial team.