Tag: CRYPTOS FoxBusiness.

  • AI tokens rally after Nvidia open-source agent plan, beat CoinDesk 20

    Cryptocurrencies linked to artificial intelligence, such as Bittensor’s $TAO, $NEAR Protocol, Internet Computer, and others rallied after Wired reported that Nvidia is preparing a new open-source platform for autonomous AI agents, a concept similar to the OpenClaw framework, ahead of its annual developer conference.

    The broader artificial intelligence token category rose about 4.8% to roughly $14.17 billion in market value, outperforming the wider crypto market, where the CoinDesk 20 index was up 2.86%. Among the majors, Bittensor’s $TAO led the move, with $NEAR Protocol and Internet Computer also advancing.

    Nvidia’s new platform, according to Wired, will be called NemoClaw. The system would allow enterprise software companies to deploy AI agents that can perform multi-step tasks for employees, and Nvidia has reportedly approached firms including Salesforce, Cisco, Google, Adobe, and CrowdStrike about potential partnerships ahead of its developer conference next week.

    Wired says NemoClaw is expected to include security and privacy tools for enterprise use and is part of Nvidia’s broader strategy to expand its software ecosystem while maintaining its dominance in AI infrastructure.

    Nvidia’s GTC developer conference begins March 17.

  • Bitcoin Pulls Back to $68K Range as Short-Term Holders Offload 27K BTC

    Bitcoin Pulls Back to $68K Range as Short-Term Holders Offload 27K BTC

    • The Bitcoin price faces an intact overhead supply at $74,000 resistance, signaling the continuation of its ongoing correction.
    • Blockchain data shows over 27,000 $BTC moved to exchanges in profit within the past 24 hours.
    • The crypto fear and greed index at 18% suggest that the broader market sentiment remains strongly bearish.

    The pioneer cryptocurrency, Bitcoin, is down 3.5% during Friday’s trading market hours to trade at $68,302. The downtick coincides with U.S. market correction following a triple threat of weak labor data, surging oil prices, and escalating geopolitical tensions, including Iran. However, the Bitcoin price faces additional pressure as short-term holders rushed to book profit when the coin briefly surged above the $70,000 mark earlier this week. Is the $60,000 breakdown close?

    $BTC Faces Selling Pressure as $1.8B Profit-Taking Hits Exchanges

    On March 6th, the cryptocurrency market experienced a significant outflow, which pushed its market cap to 2.41% down to hit $2.33 Trillion. The primary catalyst fueling this sell-off includes surging oil in the broader market amid geopolitical tension in the middle east, which also raised risk-off sentiment among investors.

    The bearish momentum further accelerated as the February 2026 US nonfarm payrolls shows an unexpected loss of 92,000 jobs against the market forecast of a 50,000 gain, with unemployment steady at 4.4%.

    However, the weak job number may raise odds of Federal Reserve rate cuts, which historically triggered a recovery in Bitcoin.

    That said, the potential uptick would still struggle to sustain higher ground as STHs (Short Term Holders) are preferring to take early profits.

    On-chain metrics indicate that more than 27,000 $BTC, worth about $1.8-1.9 billion at prevailing exchange rates, have been sent to trading platforms in gains over the last 24 hours. This represents one of the more significant single-day profit outflows in recent months.

    Participants who obtained positions about one week to one month earlier are still the primary group in positive territory, with their average cost basis being around $68,000. Short-term holders, who are sometimes defined as those who are more sensitive to price action and outside sentiment, seem to prefer quick exits rather than long exposure.

    Broader market conditions, such as cautious macroeconomic forecasts and continued geopolitical developments in the Middle East, have created an environment in which near-term caution is the order of the day. Bitcoin traded in the range of $68,000 – $69,000 in the early hours of March 2026, moving back from the recent peak on the back of high volatility and renewed selling interest from this cohort.

    Bitcoin Price Reverts After Dead Cat Bounce

    In the 48-hours, the Bitcoin price is down from $73,573 to $67,753, registering a 7.9% loss. This pullback signals intact overhead supply around $74,000 and a potential bearish reversal in the daily chart.

    With sustained selling, $BTC could lose another 8% and retest the immediate support at $62,600. Since early February, the coin price has been resonating within a narrow range from $72,600 and $74,000.

    Amid this consolidation, If the sellers manage to replenish its prevailing bearish momentum, the coin price could breach the bottom support, and extend its current downtrend to $56,000.

    $BTC/USDT -1d Chart

    On the contrary, if the coin flips the overhead resistance of $74,000 into potential support, the buyers could strengthen their grip over this asset for a higher rally to $85,000 mark.

  • Two Largest DAT Companies Double Down on Crypto Buys

    Two Largest DAT Companies Double Down on Crypto Buys

    The largest digital asset treasury (DAT) companies for Bitcoin ($BTC) and Ethereum ($ETH) added more crypto than usual to their stockpiles last week.

    Michael Saylor’s Strategy announced on Monday, March 9, that its latest weekly Bitcoin purchase totaled 17,994 $BTC at an average price of about $70,946 per coin. Last week’s buy is nearly 6x larger than the previous week’s buy of 3,015 $BTC — which itself marked a notable uptick in accumulation after weekly buys shrank since late January.

    The latest purchase bring’s Strategy’s stockpile to 738,731 $BTC as of March 8, or about $50.65 billion at current prices. The publicly traded firm remains the largest Bitcoin DAT by holdings, followed by MARA Holdings with 53,822 $BTC.

    Meanwhile, the second largest DAT company and the largest Ethereum DAT, Tom Lee’s Bitmine Immersion Technologies, announced in a press release today its most recent purchase of 60,976 $ETH, bringing its total Ethereum holdings to 4,534,563 $ETH as of March 8.

    Per the release, last week’s purchase is well above the firm’s recent weekly purchase average of 45,000-50,000 $ETH. The previous week, Bitmine bought 51,000 $ETH. Bitmine is currently staking 3,040,483 $ETH, or about 67% of the 4.5 million $ETH that it holds in its treasury.

    Also today, the second-largest Ethereum DAT, Sharplink, released its 2025 financial report. Per a press release from the firm, it recorded a $734.6 million net losses last year, a solid chunk of which — $616.2 million — were unrealized losses on its $ETH holdings.

    Sharplink announced its rebrand to an Ethereum DAT in May of last year — with Consensys CEO and Ethereum co-founder Joseph Lubin as chairman of its board. The firm has accumulated 864,840 $ETH to date, at an average cost of $3,588 per $ETH, per CoinGecko data.

    But, the spot price of $ETH had a volatile year in 2025. $ETH reached a new all-time high near $5,000 in August, only to end the year struggling near $3,000. $ETH is currently trading just over $2,000 at publishing time.

    $ETH price, May-December 2025.

  • Ethereum Foundation Decides to Stake a Significant Amount of ETH Assets

    Ethereum Foundation Decides to Stake a Significant Amount of ETH Assets

    The Ethereum Foundation, one of the main organizations in the Ethereum ecosystem, has decided to stake a portion of its treasury.

    The foundation utilizes on-chain solutions developed by Bitwise Asset Management as its infrastructure for the staking process. According to the announcement, the Ethereum Foundation started the staking process by initially depositing 2,016 $ETH. The organization’s ultimate goal is to stake approximately 70,000 $ETH. At current prices, this amount is worth approximately $140 million.

    Cryptocurrency wallets known to be linked to the Ethereum Foundation currently hold $418 million worth of $ETH. Of this amount, $354 million is held directly in $ETH, while the remainder is held as wrapped $ETH on other networks.

    At the time of writing, Ethereum staking rewards provide an annual return of 2.77% in $ETH terms. This means that the foundation will generate $3.8 million in annual revenue from this staking method in a scenario where the $ETH price remains stable.

    *This is not investment advice.

  • Here’s What Michael Saylor Thinks of Altcoins

    Here’s What Michael Saylor Thinks of Altcoins

    Table of Contents

    What Did Saylor Actually Say About Altcoins?How Does He Frame Bitcoin by Comparison?Is This Just Bitcoin Maximalism in a New Suit?One Nuance Worth NotingWhat Is the Takeaway?

    Michael Saylor thinks altcoins can deliver 100x returns. He just thinks the odds are stacked against you.

    In a February 26 interview on The Sujal Show, the Strategy founder gave one of his cleaner breakdowns of why he stays Bitcoin-only. The framing is sharper than usual and worth unpacking.

    What Did Saylor Actually Say About Altcoins?

    The interview host put the standard challenge to him directly: Bitcoin cannot go 100x or 20x from here, but altcoins can. So why not altcoins?

    Saylor did not dispute the premise. He acknowledged that some altcoins will deliver massive returns. His counterpoint was a probability argument.

    I think there are hundreds of thousands of small businesses that might become very, very big. And occasionally, a million-dollar business becomes a trillion-dollar business. But it’s one in a million.”

    He compared altcoin picking to betting on the success of startups. Most small companies never become large. Most large companies never become Apple or Google. The winners exist, but identifying them in advance is not a repeatable strategy.

    How Does He Frame Bitcoin by Comparison?

    Saylor benchmarks Bitcoin against the S&P 500 and gold, both of which he says have appreciated roughly 14% annually over the past five years. Bitcoin, by his count, has compounded at around 45% annually over the same period.

    His framing: if you want a safe index-type asset that outperforms both gold and equities without picking individual winners, Bitcoin is that instrument. You give up the moonshot. You also give up the failure rate that comes with chasing it.

    Is This Just Bitcoin Maximalism in a New Suit?

    To some extent, yes. Strategy holds 738,731 BTC and has not diversified into any other digital asset. Michael Saylor’s X account has not mentioned Ethereum, Solana, or any altcoin project in months.

    What has shifted is the volatility argument. Saylor noted that Bitcoin’s drawdown profile has been compressing over the past decade. It went from a 200 volatility asset to roughly 80 when he first bought in 2020. Now he puts it closer to 40. He expects that trend to continue as institutional capital, banks, and large corporations deepen their exposure.

    His projection: Bitcoin volatility will gradually converge toward something like the VIX over the next 20 years, but with performance staying meaningfully above S&P index returns.

    One Nuance Worth Noting

    A day before this interview, at the Strategy World 2026 conference, Saylor mentioned that Bitcoin-backed financial products, including yield-bearing instruments like Strategy’s preferred stock STRC, could be deployed on blockchains like Ethereum and Solana. Some headlines read this as a softening of his stance on altcoins.

    It was not. He was describing distribution rails for Bitcoin-collateralized products, not endorsing ETH or SOL as investment assets. His view on altcoins as speculative bets did not change.

    What Is the Takeaway?

    Saylor is not saying altcoins are worthless. He is saying that selecting the one or two that go 100x out of hundreds of thousands of candidates is not a strategy most investors can execute consistently. Most altcoins from previous cycles are down significantly or no longer exist. The few that delivered large returns were not obviously identifiable in advance.

    His answer has not changed: buy the monetary index, skip the startup lottery.


    Source:

    • The Sujal Show Full interview with Michael Saylor, February 26, 2026, covering altcoins, Bitcoin volatility, and the monetary index thesis
  • Hyperliquid price eyes $40 breakout as technical indicators turn bullish

    Hyperliquid price eyes $40 breakout as technical indicators turn bullish

    Hyperliquid price is pushing toward a key resistance zone as rising trading volume and strengthening technical signals point to growing bullish momentum in the market.

    Summary

    • Hyperliquid rose to around $32 in a possible recovery attempt towards $40..
    • Volume and open interest climbed, indicating new positions as traders anticipate further price movement.
    • Technical indicators show strengthening momentum, with resistance sitting between $33 and $36.

    Hyperliquid ($HYPE) edged higher on renewed buying, with the token trading around $32.63 at press time, up 6.6% in the past 24 hours. The price has stayed within a weekly range of $29.61 to $33.33, holding near the top of that band.

    Over the past year, Hyperliquid has been one of the stronger performers among the top 100 cryptocurrencies, gaining about 136%. Even so, it still trades roughly 45% below its September 2025 peak of $59.30.

    Trading activity has picked up as well. 24-hour spot volume reached about $289 million, a 98% increase compared with the previous day, which suggests fresh interest from traders.

    Derivatives markets show a similar pattern. Data from CoinGlass shows trading volume climbing 84% to $1.36 billion, while open interest rose 9.56% to $1.33 billion. This mix open often signals that new positions are being added rather than closed.

    Hyperliquid fundamentals grow stronger

    Beyond price action, the platform itself continues to expand. Hyperliquid now accounts for roughly 70% of decentralized perpetual futures trading volume, while daily activity on the exchange is estimated at 9.9% of the level seen on Binance.

    You might also like: Will Ethereum price fall under $1,900 as a bearish crossover forms?

    The network has also built a sizable user base. More than 665,000 traders are active on the platform, and monthly revenue is estimated at around $116 million. According to project data, about 38% of the token supply has been set aside for future ecosystem initiatives.

    New features are gradually being introduced. These include HIP-4 outcome trading and efforts to connect real-world assets to the platform.

    Supply mechanics may also play a role in the token’s dynamics. Hyperliquid runs an assistance fund that periodically buys back and burns $HYPE tokens. Roughly 4.17% of the supply, valued at about $1.36 billion, has already been removed through these operations, reducing the number of tokens in circulation.

    Hyperliquid price technical analysis

    From a technical perspective, several signals have started to lean positive. The price currently sits above the mid-Bollinger Band, which corresponds to the 20-day moving average. That area, around $29 to $30, has been acting as support in recent weeks as buyers step in during pullbacks.

    Hyperliquid price eyes $40 breakout as technical indicators turn bullish - 1

    Hyperliquid daily chart. Credit: crypto.news

    Volatility also appears to be returning. The Bollinger Bands are widening after a period of compression, a setup that traders often watch for stronger moves. At the moment, the price is pushing toward the upper band in the $33 to $36 range.

    Momentum indicators point in the same direction. The relative strength index is hovering in the upper-50 zone. Before the market enters overbought territory, that level usually denotes growing momentum while allowing room for growth.

    The chart also shows a pattern of higher lows since the rebound in late January, with buyers continuously protecting the $29 to $30 range. This kind of structure often depicts slow accumulation.

    For now, the main barrier sits between $33 and $36, where the token has struggled to move higher in recent attempts. A clear break above that zone could shift attention toward the $40 level, which many traders see as the next psychological target.

    If momentum fades, the first support lies near $29.9, while a deeper support zone sits around $26 to $27.

    Read more: Bitcoin price outlook weakens as oil jumps 60% on Strait of Hormuz risks

  • Historical XRP Pattern Returns as One Bearish Metric Drops 80% — Trend Reversal Ahead?

    Historical XRP Pattern Returns as One Bearish Metric Drops 80% — Trend Reversal Ahead?

    $XRP price may be approaching a critical moment after weeks of downside pressure. The token has remained down roughly 8% over the past 30 days, showing that the broader structure is still bearish.

    However, a historical chart formation that previously triggered a rebound has appeared again. This time, the signal is accompanied by a sharp collapse in coin distribution and rising holder conviction, raising the possibility that $XRP could attempt a trend reversal if key levels break.


    Historical Divergence Returns as $XRP Prints the Same Bounce Setup

    The current setup begins with a bullish divergence on the Relative Strength Index (RSI). RSI is a momentum indicator that measures the speed and strength of price movements. When price falls, but RSI rises, it often signals that selling momentum is weakening.

    Between February 11 and March 8, $XRP’s price formed a lower low, while RSI formed a higher low. This is a pattern that often appears near potential trend reversal zones, assuming the fact that the broader $XRP price trend still leans bearish.

    Note: While this divergence pattern conceptually hints at a reversal, we would be using the word ‘rebound’ interchangeably, considering the bearish market sentiments.

    Interestingly, $XRP printed a nearly identical divergence earlier. Between February 12 and February 24, the price also made a lower low while RSI formed a higher low. Shortly after that signal appeared, $XRP rallied about 14%, confirming the divergence’s effectiveness.

    Want more token insights like this? Sign up for Editor Harsh Notariya’s Daily Crypto Newsletter here.

    Historical $XRP Pattern: TradingView

    However, technical patterns alone rarely drive price moves. The strength of the current divergence becomes clearer when examining on-chain distribution activity.


    $XRP Distribution Activity Collapses as Selling Sentiment Fades

    One of the most important supporting signals comes from the Spent Coins age band data. This metric tracks how many tokens move on-chain each day, often signaling potential distribution.

    During the earlier February divergence, spent coins declined from 75.58 million $XRP to nearly 43 million $XRP, representing a 43% drop in distribution activity.

    Spent Coins Movement

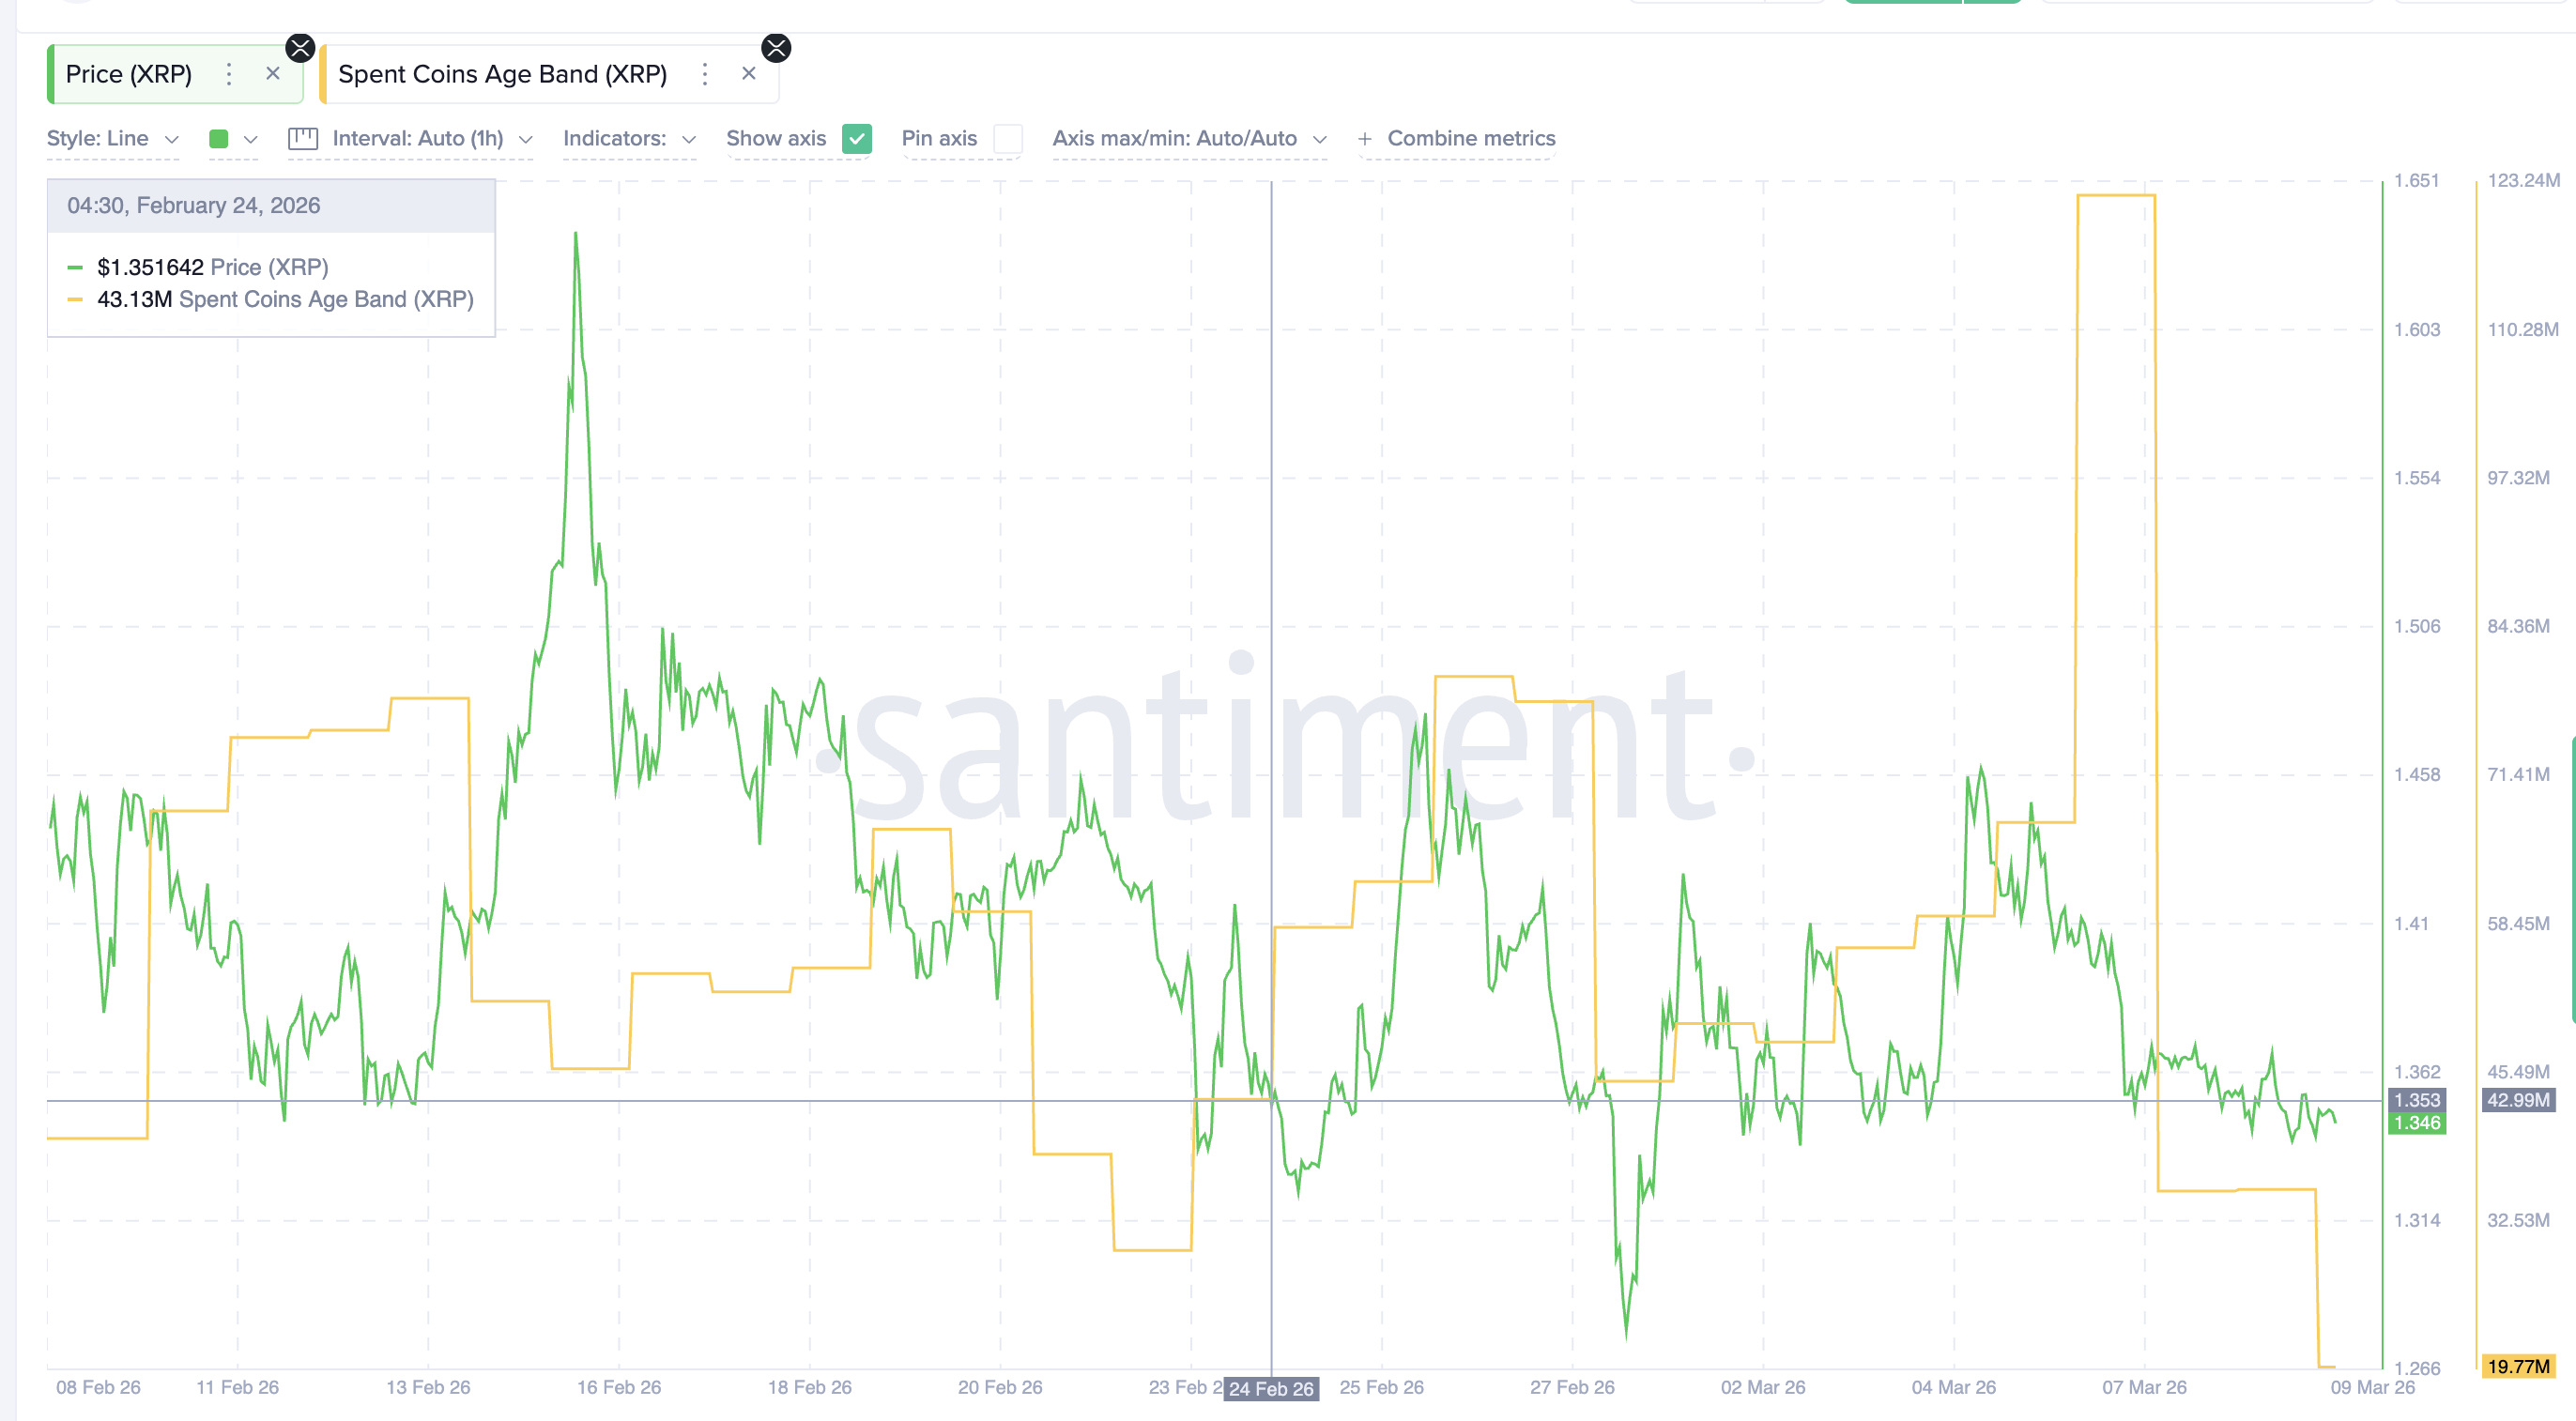
    Spent Coins Movement: Santiment

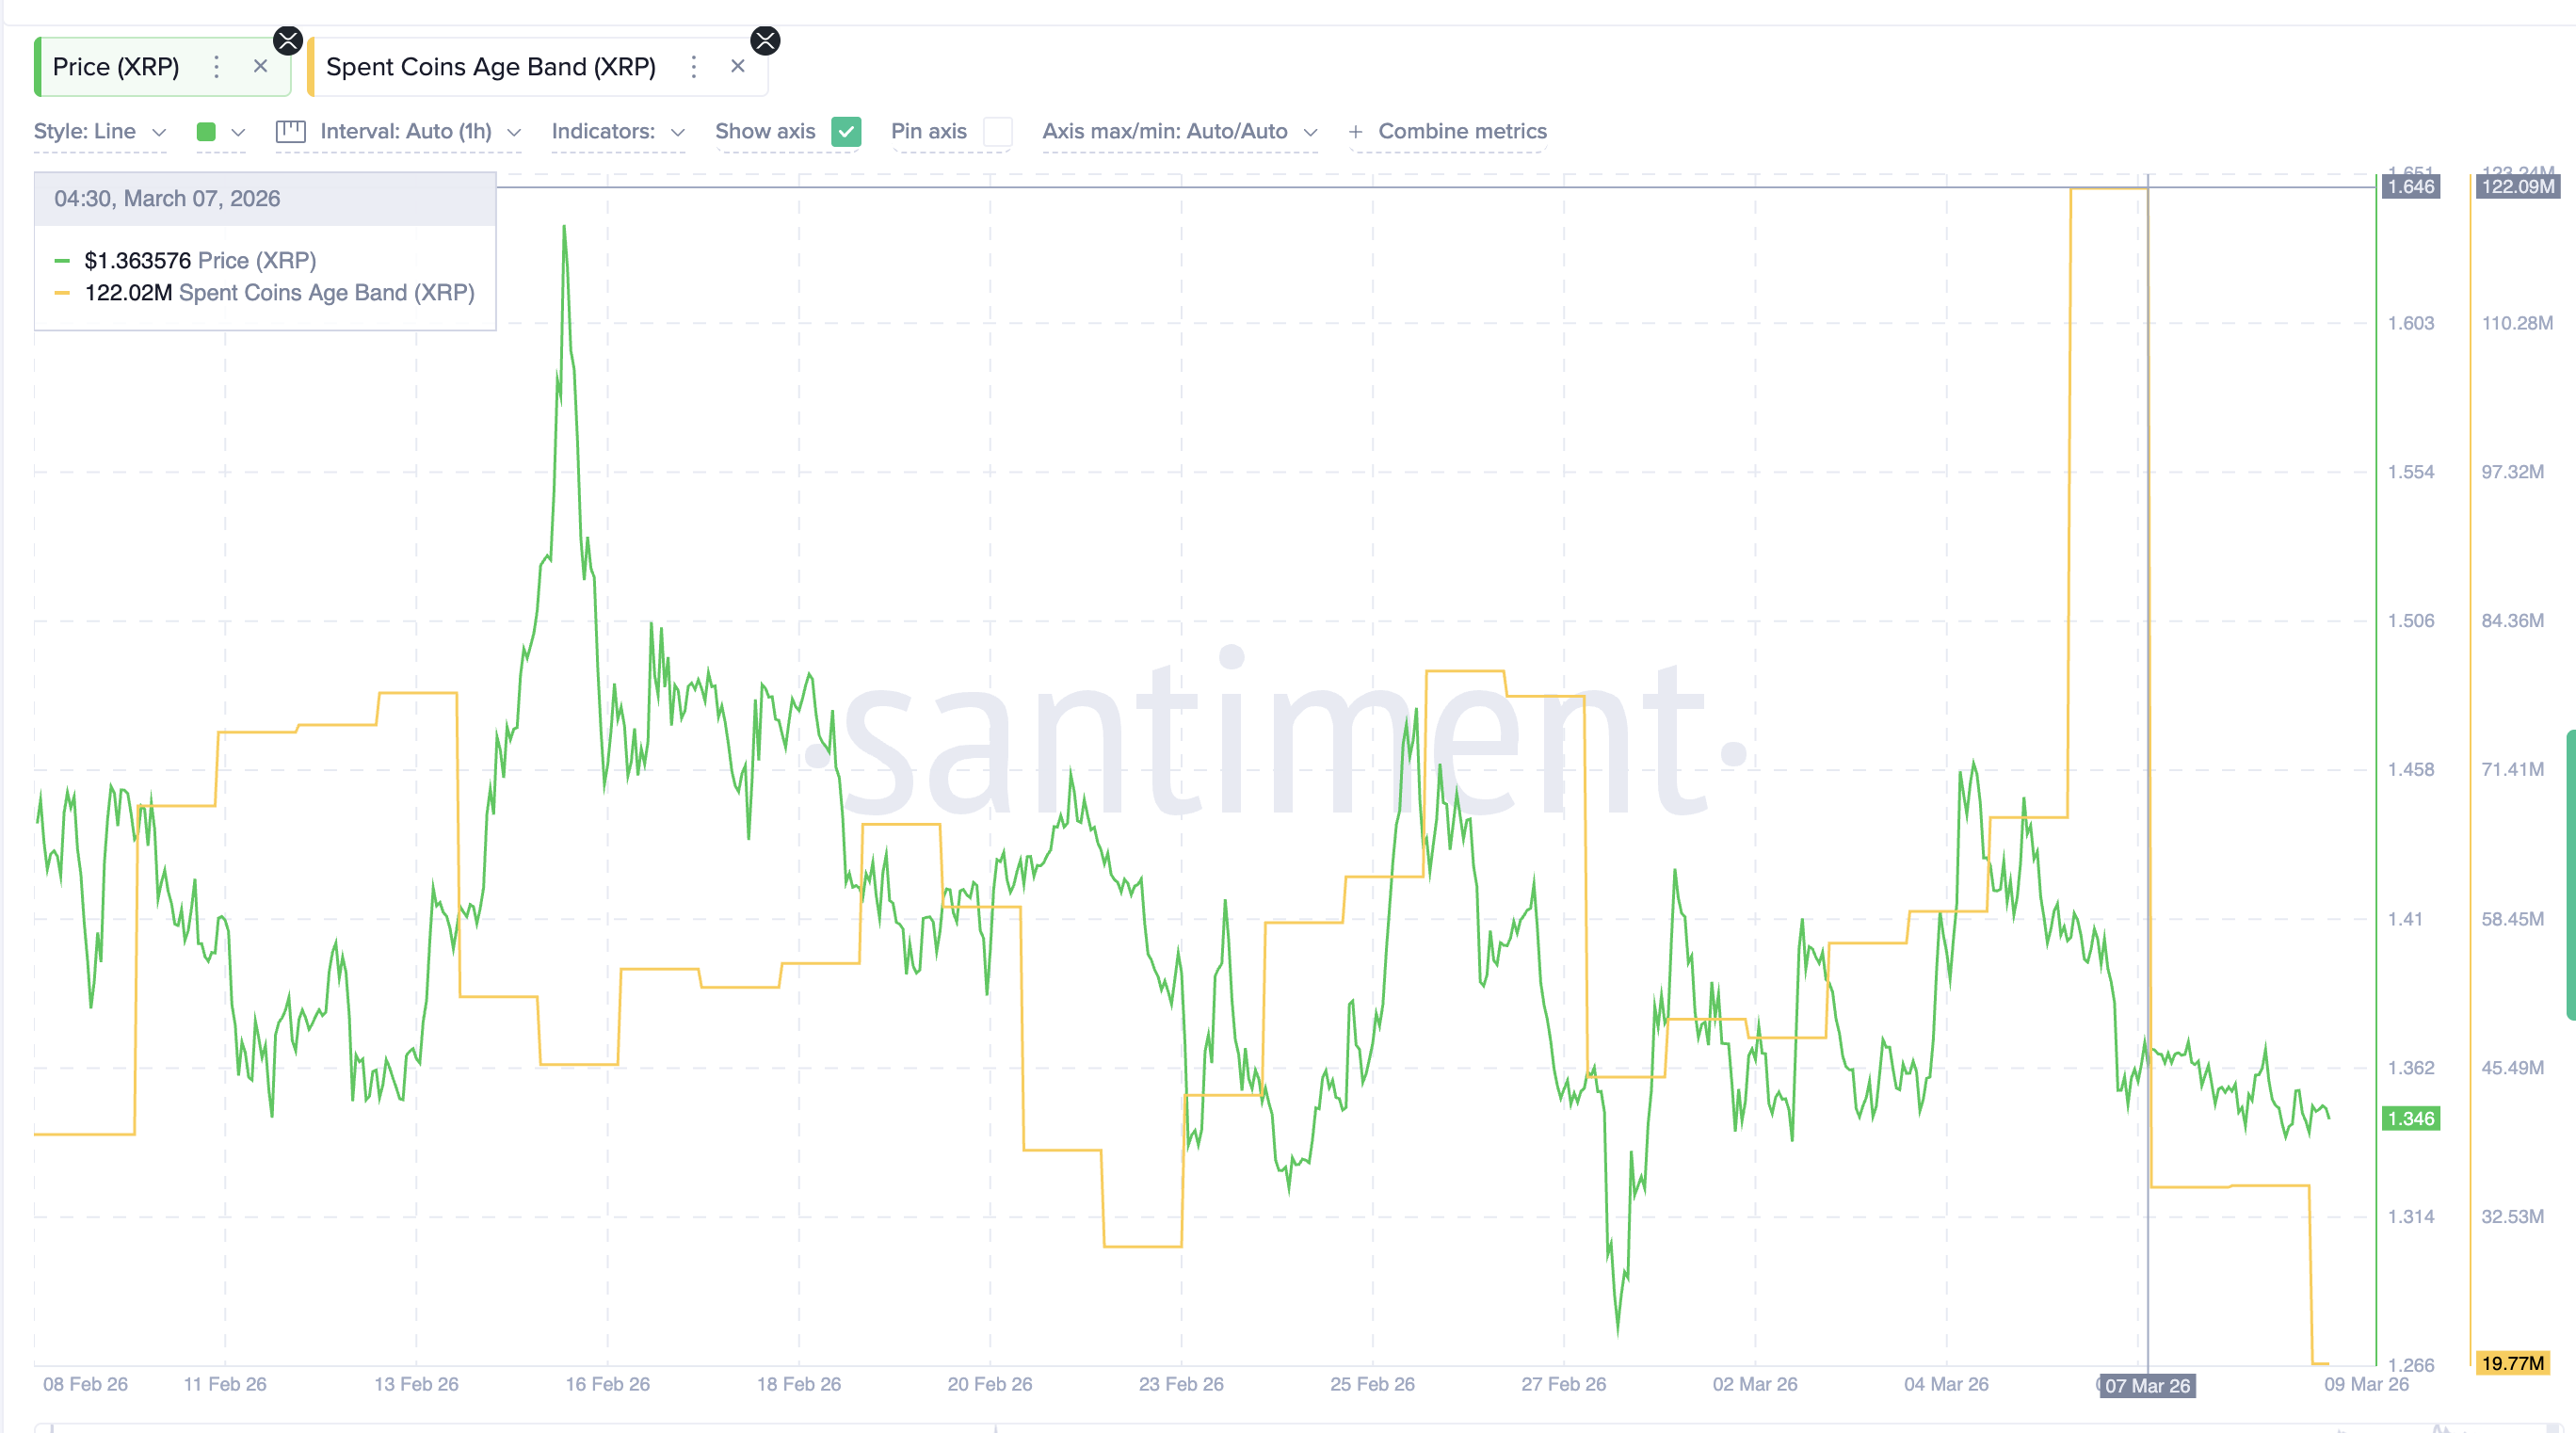
    The current divergence shows a far sharper change. On March 7, spent coins surged to 122 million $XRP, signaling heavy coin movement. But by March 8, the figure collapsed to 19.77 million $XRP, marking an over 80% drop in distribution activity.

    <span class=$XRP Coin Activity”>

    $XRP Coin Activity: Santiment

    Such a steep decline in this bearish metric suggests that selling activity may have dried up rapidly after the divergence formed. With fewer coins moving on-chain, the market may be entering a period where holders prefer holding rather than distributing tokens.

    That behavior becomes even more visible when looking at long-term holder accumulation.


    Hodler Accumulation and Derivatives Strengthen the Reversal Setup

    Another key indicator is Hodler Net Position Change, which tracks how much supply long-term holders accumulate or distribute over a 30-day period.

    During the February divergence, this metric showed only modest growth. On February 12, the net position change stood near 126.8 million $XRP, rising slightly to about 149.3 million $XRP by February 24—an increase of roughly 17%.

    The current divergence shows stronger conviction. By March 3, the metric had dropped sharply to around 41.4 million $XRP, but it rebounded quickly to 211.6 million $XRP by March 8 when the divergence appeared.

    Compared with the 149 million $XRP level seen during the previous rebound signal (February 14), the current figure represents roughly 42% higher accumulation, indicating stronger holder conviction behind the potential reversal setup.

    Hodler Net Position Change

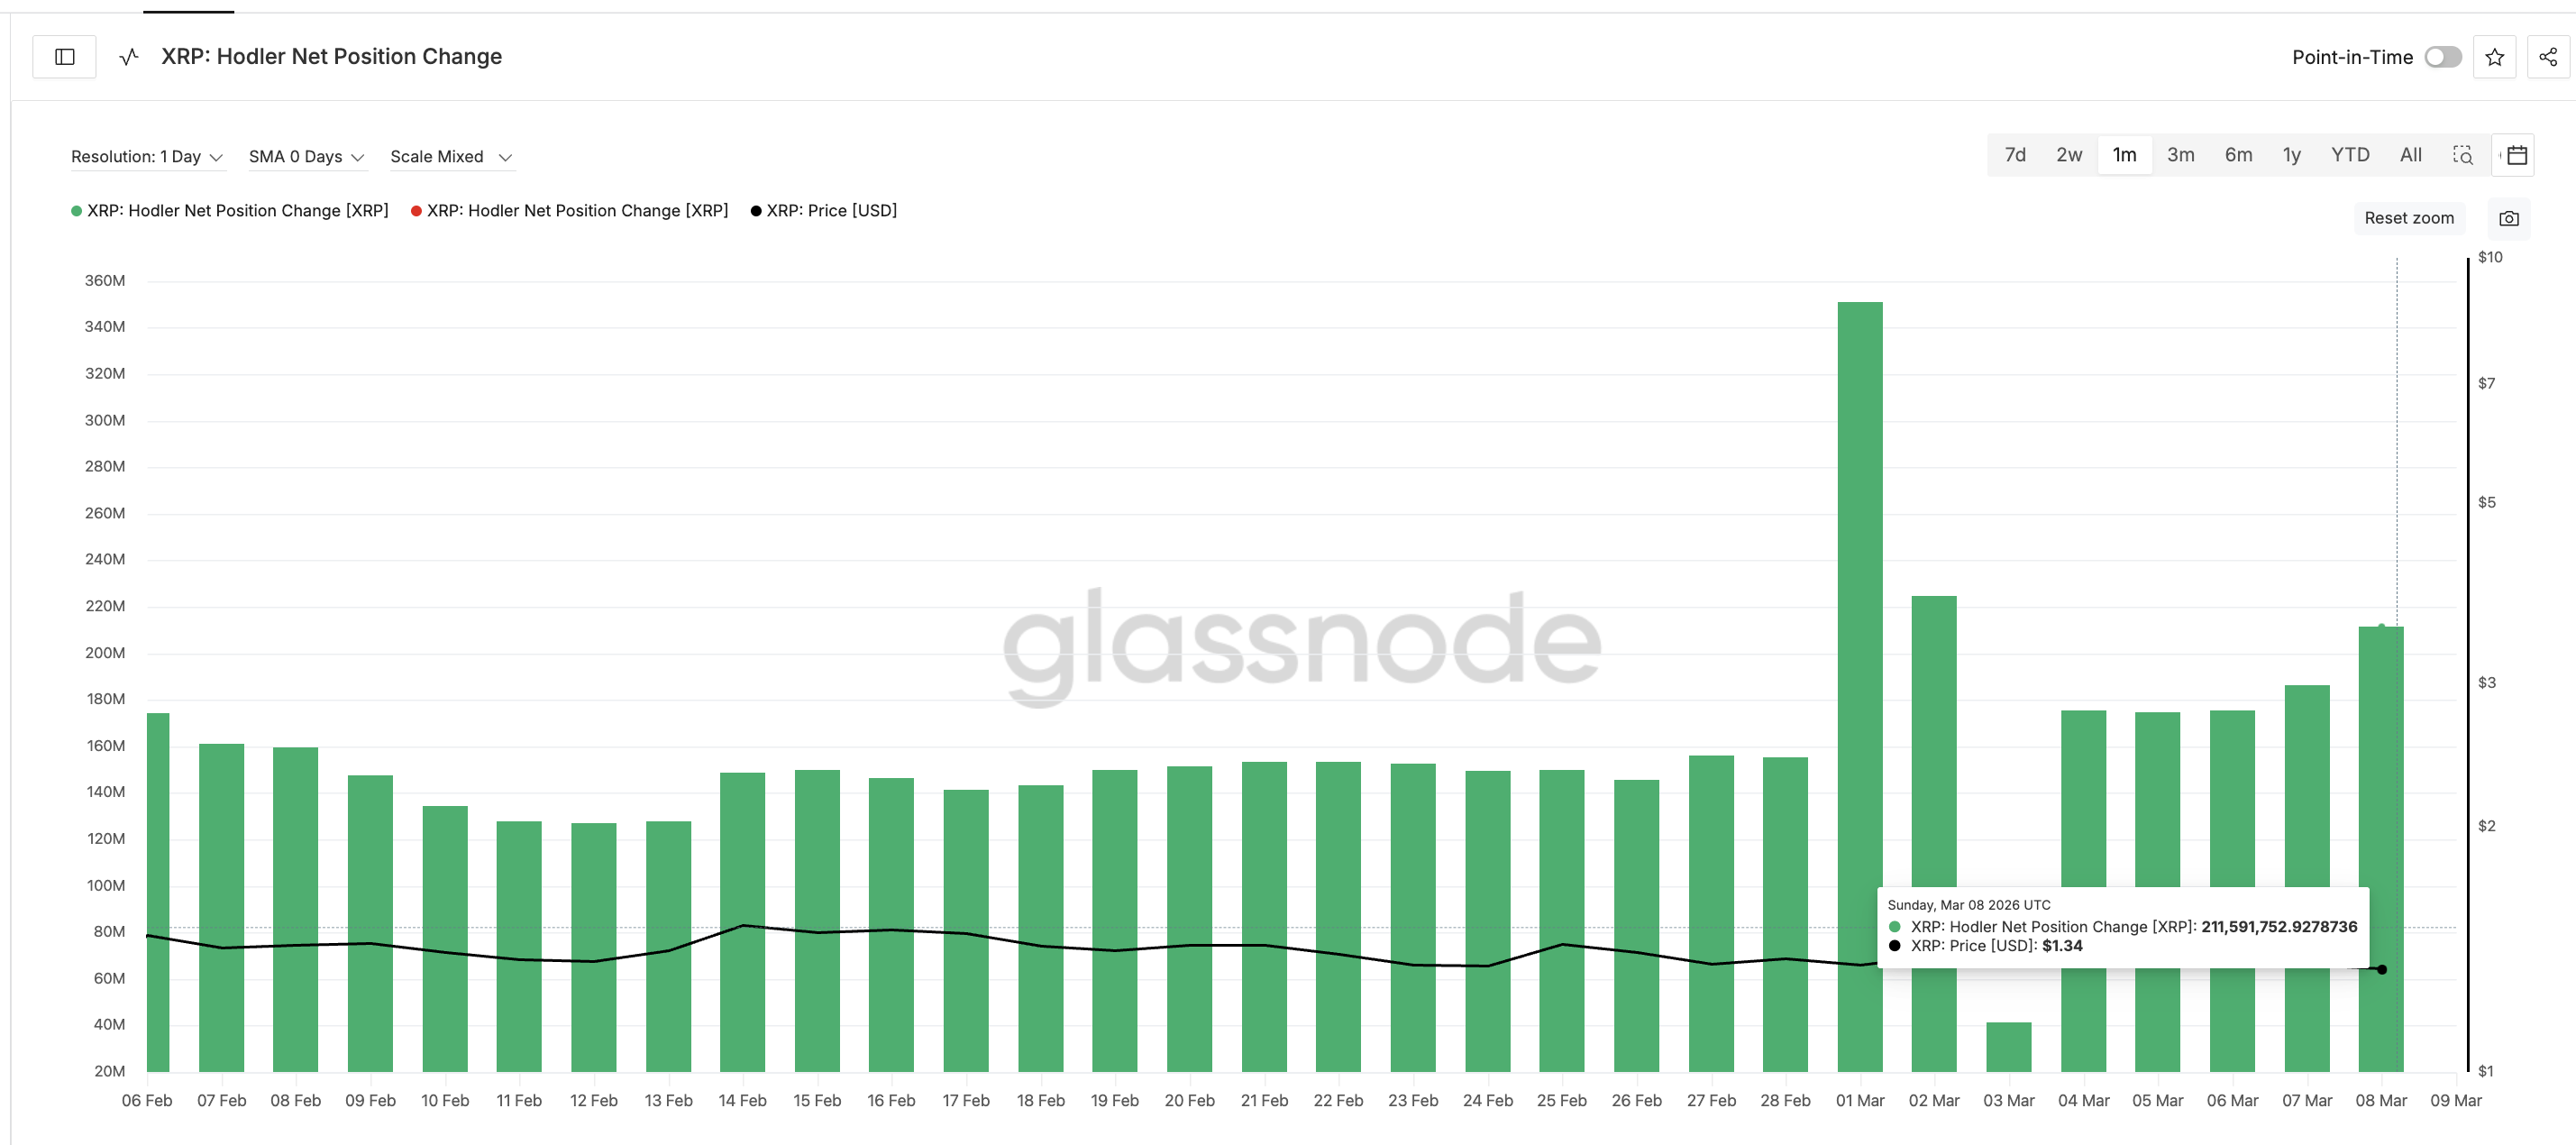
    Hodler Net Position Change: Glassnode

    But spot market behavior is only part of the story. Derivatives positioning suggests another possible catalyst.

    Derivatives data shows that short positions dominate $XRP’s leverage structure. Liquidation data, per the $XRP/USDT pair on Binance alone, indicates that roughly $110.8 million in short leverage sits above current prices, compared with only $42.1 million in long leverage. In other words, short exposure is about 163% larger than long exposure.

    More importantly, over 50% of these short liquidations cluster around the $1.39 level.

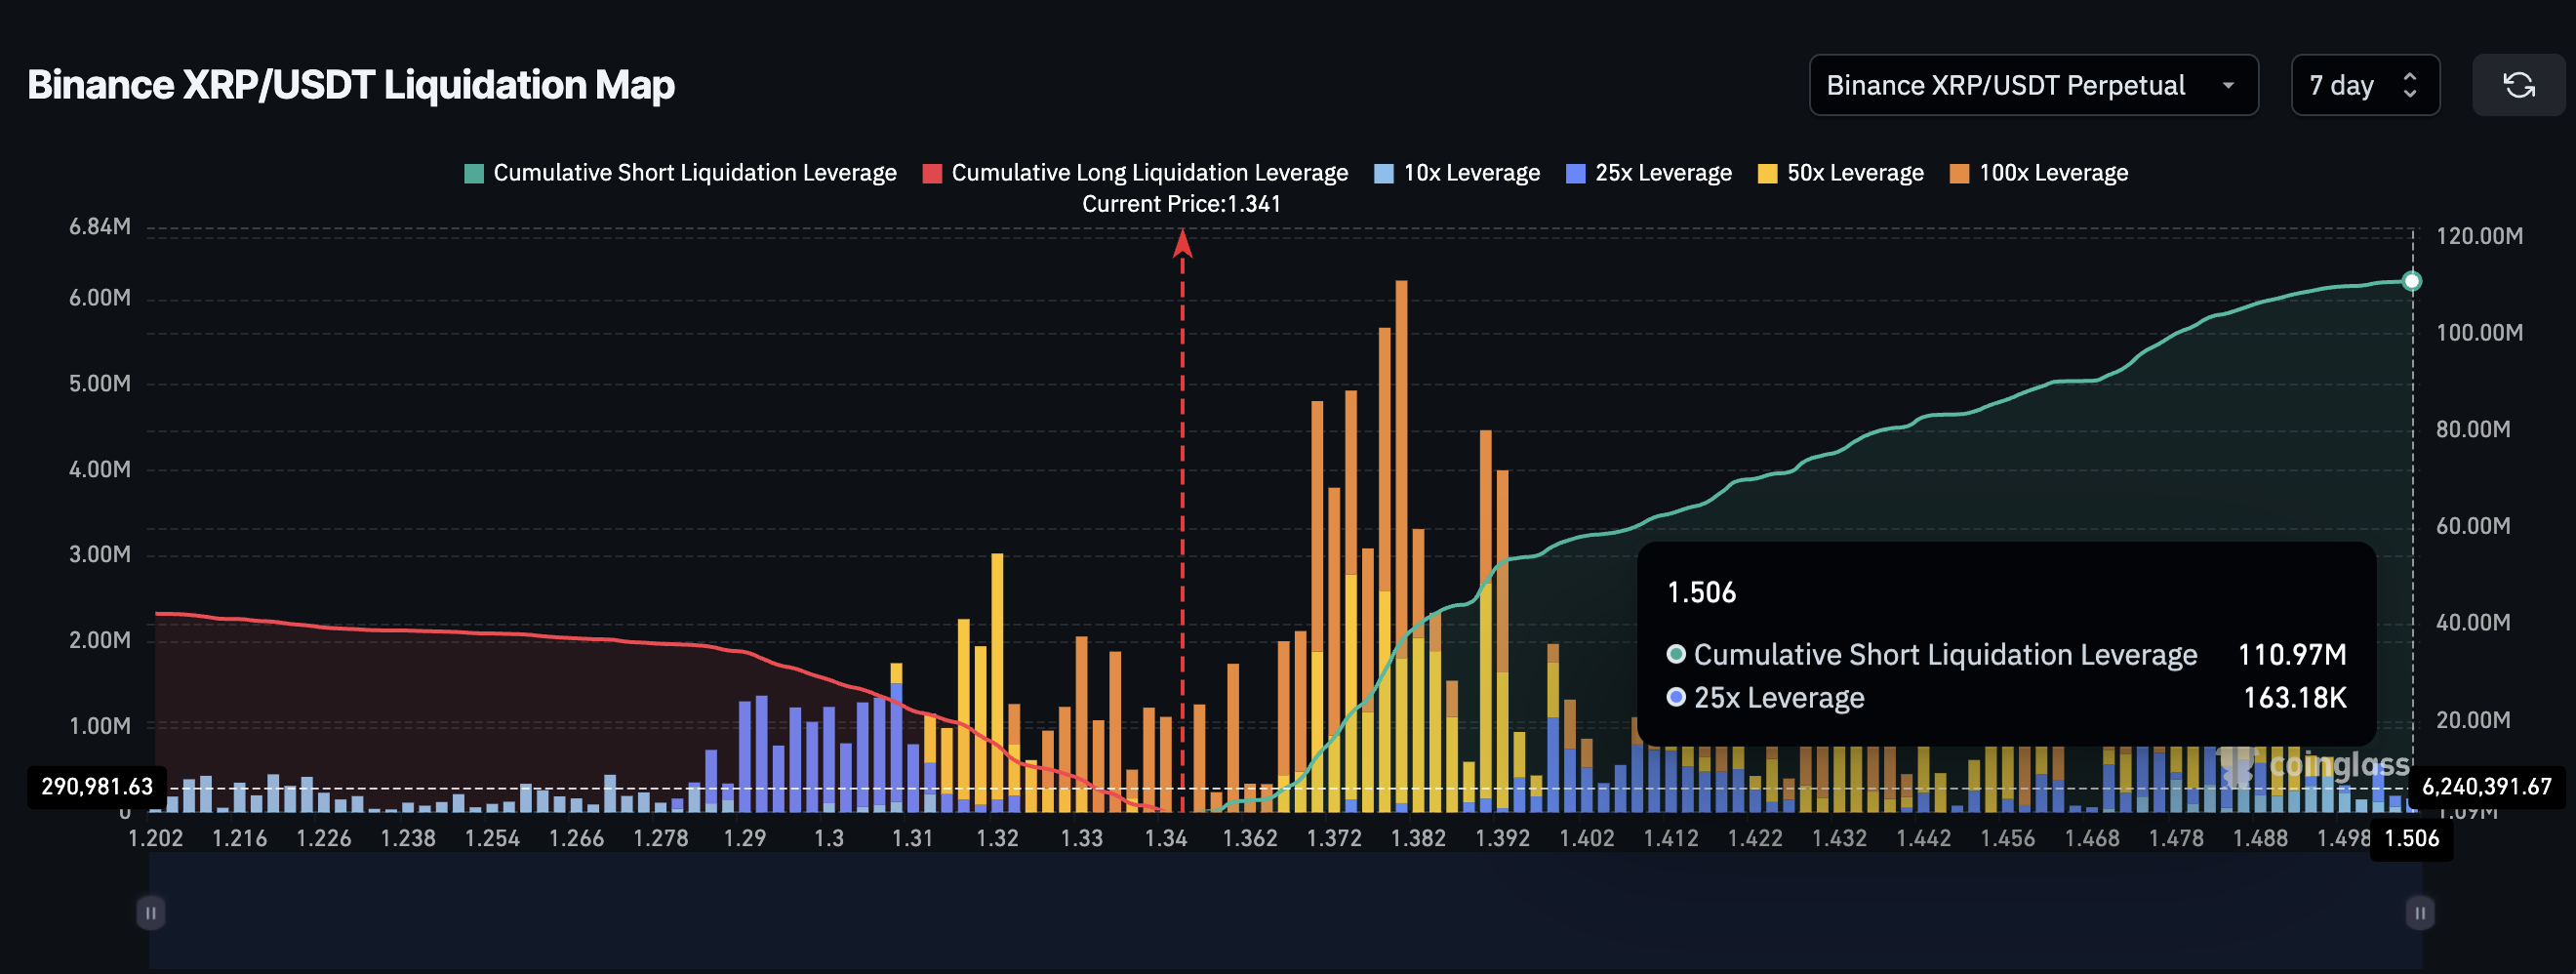
    $XRP Liquidation Map: Coinglass

    If $XRP pushes toward $1.40 (a round figure), a large portion of these short positions could be forced to close. This type of forced buying, known as a short squeeze, often accelerates upward momentum.


    $XRP Price Levels That Could Confirm a Reversal

    From a technical perspective, $XRP must first overcome $1.40, the level where large clusters of short liquidations sit. A break above that zone could trigger further upside toward $1.54, representing roughly 10% upside from current levels.

    If momentum strengthens further, $XRP could target $1.61, marking a potential 20% rally from the current range. The 10% to 20% rally range aligns with the bullish push seen during the historical divergence pattern from earlier.

    However, downside risks remain. If $XRP drops below $1.32, the current divergence structure would weaken. A deeper move under $1.27 would invalidate the bullish setup entirely and reinforce the broader bearish trend.

    $XRP Price Analysis: TradingView

    For now, $XRP sits at a technical crossroads. A historical divergence has returned, distribution activity has dropped sharply, and holder accumulation has strengthened. Whether these signals translate into a true trend reversal may depend on whether buyers can push the price beyond the $1.40 trigger level.

    The post Historical $XRP Pattern Returns as One Bearish Metric Drops 80% — Trend Reversal Ahead? appeared first on BeInCrypto.

  • Another Important Milestone for the Cryptocurrency Ecosystem Passed! The 20 Millionth BTC Successfully Minted!

    Another Important Milestone for the Cryptocurrency Ecosystem Passed! The 20 Millionth BTC Successfully Minted!

    The cryptocurrency ecosystem has passed another significant milestone. The 20 millionth unit of Bitcoin, the world’s first and largest cryptocurrency, has been successfully minted. This development is considered a major milestone reached by the Bitcoin network approximately 17 years, 2 months, and 1 week after the first block was created in January 2009.

    The Bitcoin network is built on a system with a total supply limited to 21 million. With the creation of the 20 millionth Bitcoin, the total amount in circulation has reached approximately 95.2% of the theoretical supply. This demonstrates that Bitcoin’s scarcity-based economic model is becoming increasingly evident.

    According to blockchain data shared by the crypto data platform Mempool, the Bitcoin in question was mined in block number 939,999 on the network. This block was produced by the US-based mining pool Foundry USA. This marks another historic milestone in Bitcoin mining.

    Due to Bitcoin’s block production mechanism, the rate at which new coins are mined decreases over time. The halving process, which occurs approximately every four years, reduces the block reward given to miners, thus slowing down the production of new Bitcoins. This mechanism ensures that the total supply of the network increases in a controlled and predictable manner.

    According to experts, mining the remaining approximately 1 million Bitcoins will take a very long time. Under current protocol rules, this amount is expected to gradually enter circulation through mining over the next 114 years.

    Crypto market analysts say that the mining of the 20 millionth Bitcoin once again highlights the digital asset’s limited supply model and creates a psychological threshold that could affect price dynamics in the long term.

    *This is not investment advice.

  • Crypto funding up 50% in 12 months as fewer, larger deals dominate

    Crypto funding up 50% in 12 months as fewer, larger deals dominate

    Crypto fundraising increased by almost 50% year-on-year between March 2025 and March 2026, despite the number of deals dropping 46% as VCs concentrated bets on late-stage and strategic mega-rounds.

    Messari’s crypto fundraising overview shared by the company’s CEO Eric Turner on Sunday shows that the average deal size increased to $34 million in the last 12 months, up 272% from a year earlier. This came as the number of active investors fell 34.5% to 3,225.

    “Capital concentration is heavily skewed by late-stage and strategic mega-rounds,” Messari said, noting that in February, just three fundraising events contributed 44% of the $795 million raised over the last month.

    This included Tether’s $200 million investment into online marketplace Whop; $75 million raised for sports-focused peer-to-peer prediction market Novig in a Series B funding round led by Pantera Capital; and ARQ, a Latin American fintech app focused on stablecoins that secured $70 million in Series B funding on Wednesday, led by Sequoia Capital.

    Monthly change in crypto fundraising over the last five years. Source: Messari

    The $795 million figure marks a 65.3% fall from the previous 30 days.

    Turner noted that, outside of Dragonfly Capital, no major VCs have closed new funding rounds lately, adding that “the industry needs some fresh capital.”

    Meanwhile, Coinbase Ventures, QUBIC Labs, and Somnia have been the most active crypto investors over the past three months, Messari data shows.

    Crypto funding nowhere near 2021-2022 levels

    Monthly crypto fundraising has cooled significantly since its peaks in November 2021 and May 2022, when funding consistently hit $4 billion per month.

    Since then, the $4 billion milestone has been reached only three times. Some investors have started to expand their focus toward the AI and high-performance computing sectors.

    Related: Kalshi, Polymarket eye $20B valuations in potential fundraising: WSJ

    While most crypto fundraising has focused on late-stage activity, Messari noted that early-stage fundraising “remains high in volume but fragmented.”

    Messari pointed out that Interstate’s $1.5 million funding round on Thursday came from more than 15 participants, ranging from firms like Bloccelerate VC to individual angel investors like Sergey Gorbunov.

    Magazine: What’s a ‘Network State’ and are there real-life examples? Big Questions