Tag: CRYPTOS FoxBusiness.

  • Uniswap price pops 20% to $4 amid oversold rebound

    Uniswap price pops 20% to $4 amid oversold rebound

    • Uniswap price jumped to above $4 on Wednesday as Bitcoin retested $68,000.
    • The $UNI token could eye $5 amid an oversold bounce across crypto.
    • If bulls fail to rally, key support lies around $3.48 and $3.00.

    Uniswap ($UNI) price has surged nearly 20% in recent trading, climbing to intraday highs above $4.00 as top altcoins retest critical resistance levels.

    This rebound aligns with Bitcoin’s spike in the past 24 hours, which sees BTC trade above $68,000 and altcoins, including Ethereum, XRP, and BNB, target oversold bounces above $2,000, $1.50, and $620, respectively.

    As with these top altcoins, on-chain data shows Uniswap price ticking up from oversold conditions. Morpho was among the coins to see sharp gains on the day.

    Uniswap price pumps to above $4

    The sharp decline on February 5, 2026, saw $UNI price dump to $3.00, and a subsequent attempt to break higher failed as prices hovered in a range capped at around $3.60.

    Overall, weakness in digital assets amid macro headwinds contributed to this outlook.

    However, despite risk assets remaining largely bearish, $UNI’s uptick to $4.00 amid a 62% spike in daily volume reflects fresh optimism.

    Uniswap’s gains in the past 24 hours build on the positive movement that followed BlackRock’s recent strategic purchase of $UNI.

    The global asset management giant plans to use the tokens to facilitate trading of its BUIDL tokenized Treasury fund via Uniswap.

    Data on the market platform Coinglass highlights the improvement in on-chain metrics for $UNI.

    Open interest is picking up, and funding rates are positive. This suggests recent weakness has provided entry opportunities for buyers.

    Bitcoin’s push above $68,000 and Ethereum’s breach of $2,000 may catalyze further gains for small-cap tokens.

    What next for $UNI price?

    Although Uniswap’s price is up by double digits on the day, it remains in the red over the past week, month, and year-to-date.

    Uniswap Price Chart

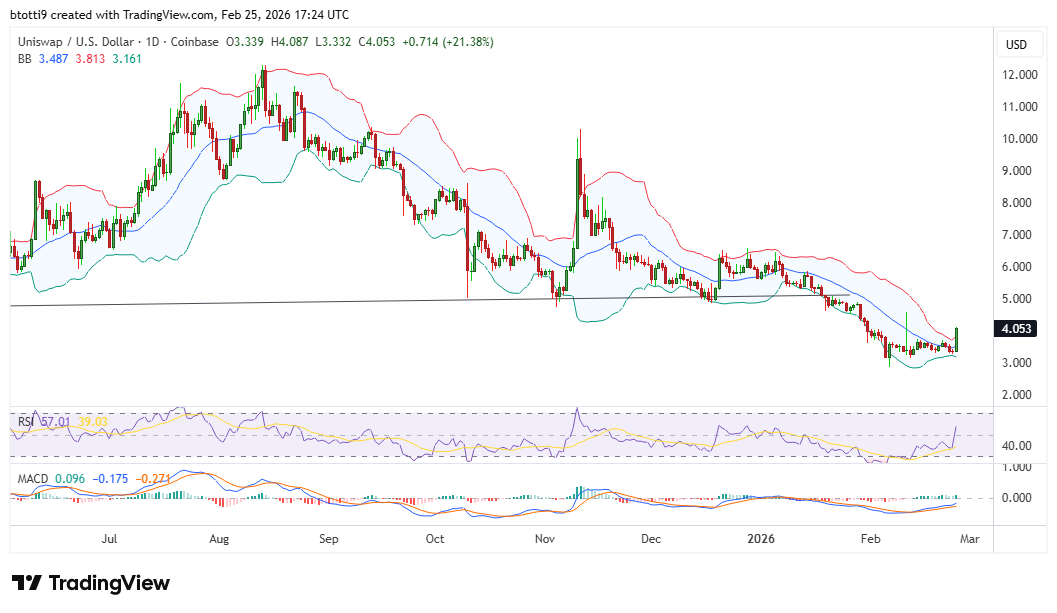
    Uniswap price chart by TradingView

    Technical indicators also suggest that $UNI at $4.00 is below key moving averages, including the 50-day, 100-day, and 200-day SMAs.

    Daily RSI at 56, however, signals an extended bounce from oversold territory, and significantly, has room for another leg up before bulls hit overbought extremes.

    Meanwhile, the MACD histogram hints at fresh bullish momentum with $3.20 having formed a potential bottom.

    Bollinger Bands position $UNI above the upper band, which is currently at $3.81.

    If prices break above the 50-day SMA, bulls will have eyes on the 100 SMA ($5.09).

    This hurdle aligns with a horizontal resistance line that also acted as support in November and December 2025.

    However, near-term bearish targets are alive. The lower Bollinger band at $3.48 offers the first major demand reload zone. Below this, bulls could rely on support at $3.00.

  • Largest BNB treasury crashes 95%, blames CZ family office

    Largest BNB treasury crashes 95%, blames CZ family office

    The world’s largest $BNB treasury company has crashed 95% from its high last year and is blaming the family office of Binance founder Changpeng Zhao (CZ) for a “secret side agreement.”

    On Tuesday, it issued a press release demanding that CZ’s YZi Labs disclose a confidentiality provision between his family office and 10X Capital Asset Management LLC, the lead party in the company’s July 2025 PIPE transaction that coincided with its 52-week and multi-year high of $82.88 per share.

    Shares of CEA Industries, which changed Nasdaq ticker symbols from VAPE to BNC — an attempt to pivot the company’s brand to a $BNB Network Company — now trade at $3.88 after losing 95% of their value over the past seven months.

    Before becoming a $BNB treasury company during the height of the digital asset treasury (DAT) mania in the summer of 2025, CEA Industries was operating Canadian vape retailers.

    That business model, as well as several business models and pivots including a previous ticker change from CEAD to VAPE, failed to reverse a multi-year decline in its common stock from a $873 peak in 2018 to under $8 by the time of its acquisition of 33 Canadian vape locations.

    By July 2025, the company had yet again began looking for a new trend.

    It found a suitor in Cantor Fitzgerald, founded by US Commerce Secretary and Jeffrey Epstein’s former neighbor Howard Lutnick, who acted as the lead financial advisor to 10X Capital and sole placement agent to CEA Industries.

    Read more: Binance demands the Wall Street Journal remove ‘damaging’ article

    Another Cantor Fitzgerald-advised treasury flop

    Cantor Fitzgerald helped raise capital for other DATs like Twenty One, Bitcoin Standard Treasury Company, and Nakamoto.

    In fact, the same 10X Capital that led CEA Industries’ $500 million PIPE also served as financial advisor to Nakamoto, which has declined 99% in value from its May 2025 peak. Twenty One is down 89% since May, and Bitcoin Standard Treasury Company is down 37% since July.

    Despite its financial devastation, CEA Industries’ 95% decline is somewhat unremarkable among DATs.

    10X Capital acted as CEA Industries’ $BNB asset manager “with the support of YZi Labs.” According to CEA Industries, that support is potentially problematic, and it wants to force disclosure of how, exactly, CZ’s family office “supported” 10X Capital’s management of $BNB.

    10X Capital’s Chief Investment Officer (CIO) Russell Read became CIO of CEA Industries shortly after the PIPE closed.

    By September, the company had relegated him to a non-executive position and by the end of the year, he’d resigned entirely.

    Almost everyone lost in $BNB treasury debut

    Some of the biggest crypto funds invested in CEA Industries via the PIPE, including Pantera Capital, GSR, Arrington Capital, Borderless, Blockchain.com, Arche Capital, Hypersphere Capital, Kenetic, and the founders of BitFury.

    There are two sides to every story.

    For its part, YZi Labs has contested CEA Industries’ characterization of the “secret side agreement” as recently as this week.

    YZi Labs wants CEA Industries to retract what it calls false claims about that agreement, and it’s requested directors Hans Thomas and David Namdar recuse themselves from asset management discussions.

    It also wants to solicit stockholder written consents for board changes.

    Amid the infighting, CEA’s common stock has fallen 41% year to date, 67% over the past 12 months, 95% from its 52-week high, and 98% over the past five years.

  • XRP Price Rally Accelerates, $1.50 Resistance Could Decide Next Move

    XRP Price Rally Accelerates, $1.50 Resistance Could Decide Next Move

    $XRP price started a decent increase above $1.40. The price is now consolidating gains and might aim for more gains above the $1.50 zone.

    • $XRP price started a decent upward move above the $1.420 zone.
    • The price is now trading above $1.4250 and the 100-hourly Simple Moving Average.
    • There was a break above a key bearish trend line with resistance at $1.3820 on the hourly chart of the $XRP/USD pair (data source from Kraken).
    • The pair could continue to move up if it settles above $1.50.

    $XRP Price Rally Reaches Resistance

    $XRP price started a fresh upward move above $1.40 and $1.420, like Bitcoin and Ethereum. The price gained pace for a clear move above the $1.450 resistance.

    There was a break above a key bearish trend line with resistance at $1.3820 on the hourly chart of the $XRP/USD pair. The bulls even pumped the price toward the $1.50 zone. A high was formed at $1.4936 and the price started a consolidation phase. There was a drop below the 23.6% Fib retracement level of the upward move from the $1.3125 swing low to the $1.4936 high.

    The price is now trading above $1.420 and the 100-hourly Simple Moving Average. If there is a fresh upward move, the price might face resistance near the $1.460 level. The first major resistance is near the $1.50 level, above which the price could rise and test $1.5450. A clear move above the $1.5450 resistance might send the price toward the $1.650 resistance. Any more gains might send the price toward the $1.720 resistance. The next major hurdle for the bulls might be near $1.80.

    Another Decline?

    If $XRP fails to clear the $1.460 resistance zone, it could start a fresh decline. Initial support on the downside is near the $1.420 level. The next major support is near the $1.4030 level or the 50% Fib retracement level of the upward move from the $1.3125 swing low to the $1.4936 high.

    If there is a downside break and a close below the $1.4030 level, the price might continue to decline toward $1.3820. The next major support sits near the $1.3430 zone, below which the price could continue lower toward $1.320.

    Technical Indicators

    Hourly MACD – The MACD for $XRP/USD is now losing pace in the bullish zone.

    Hourly RSI (Relative Strength Index) – The RSI for $XRP/USD is now above the 50 level.

    Major Support Levels – $1.420 and $1.4030.

    Major Resistance Levels – $1.460 and $1.50.

  • Ethereum Undervalued, Bitcoin & XRP Remain Neutral Amid Recent Bullish Reversal

    Ethereum Undervalued, Bitcoin & XRP Remain Neutral Amid Recent Bullish Reversal

    • MVRV shows $ETH is mildly undervalued, while $BTC, $XRP, and Chainlink remain neutral.

    • The crypto market is now witnessing an upward trend reversal despite recent bearish trends.

    • Buyers show renewed interest in crypto following Nvidia earnings report.

    Based on the 30-day Market Value to Realized Value (MVRV) Ratio, Ethereum ($ETH) is mildly undervalued at -5.5%. Bitcoin ($BTC), $XRP ($XRP), and Chainlink ($LINK) remain neutral at -1.4%, -0.1%, and +3.3%, respectively. By contrast, Cardano (ADA) is mildly overvalued, with an MVRV ratio of +6.8%.

    Source: Santiment

    Bitcoin and the wider crypto market showcase a bullish trend reversal

    The past day has seen an upward trend reversal in the broader cryptocurrency ecosystem, despite recent bearish momentum and sentiment.

    Data shows that the average Moving Average Convergence Divergence (MACD) indicator has slightly surpassed its 9-day average, indicating a weak bullish momentum reversal.

    $BTC was up 7.78% in the past day to trade at $69,050 as $ETH gained 13.31% to reclaim its $2,000 psychological level. Meanwhile, $XRP and $LINK gained +9.37% and 16.07%, respectively. Uniquely, Cardano has experienced a striking 20.07% upsurge to trade at $0.3115.

    Source: CoinMarketCap

    Events leading up to the recent crypto rally

    Tech company Nvidia recently reported record-breaking earnings driven by demand in artificial intelligence (AI). Due to the strong correlation (98%) of crypto with the S&P 500, the news fueled renewed risk appetite in investors of both stocks and crypto.

    Capital rotation from $BTC to altcoins has contributed to their recent rallies as investors seek higher returns from riskier assets. Bitcoin dominance is now at 58-60%, while the Altcoin Season Index reads 34/100, indicating a mixed market for Bitcoin and Altcoins.

    This week, Bitcoin ETFs saw $257.7M in net inflows, effectively ending a five-week outflow streak.

    Near-term market outlook

    At press time, the overall crypto market cap totaled $2.38 trillion, having gained 7.50% in the last 24hours.

    Should the current rally hold, the crypto market could test the $2.59T (50% Fibonacci) level. Falling below $2.35T (78.6% Fib) would indicate a loss in momentum, validating a weak bullish theory.

  • Trump-backed World Liberty plans governance staking overhaul to reward active participation

    Trump-backed World Liberty plans governance staking overhaul to reward active participation

    World Liberty Financial, a DeFi platform backed by the Trump family, has put forward a governance proposal that would require holders of unlocked $WLFI tokens to stake them to vote, while offering staking rewards to those who actively participate in governance.

    Under the plan introduced on February 26, $WLFI holders must lock their tokens for at least 180 days to take part in governance voting.

    Participants who cast at least 2 governance votes during their lock-up period would receive an estimated 2% annual return paid from the project’s treasury.

    Voting power would be measured by both stake size and remaining lock-up duration using a non-linear formula to limit concentration among the largest holders. The system also links staking to deposit incentives on $USD1, World Liberty’s flagship stablecoin.

    The proposal also establishes Node and Super Node tiers for larger stakers, offering additional incentives such as access to licensed market makers for 1:1 $USD1 stablecoin conversions and prioritized partnership engagement.

    To become a “Node,” users must stake at least 10 million $WLFI, valued at roughly $1 million at current prices.

    These participants would gain access to licensed market makers facilitating 1:1 conversions of supported stablecoins such as USDT and USDC into $USD1, as well as $USD1 off-ramps into US dollars.

    The move would redirect arbitrage profits from institutional market makers to committed token holders, while strengthening demand for $USD1 and tying governance power to long-term capital commitments.

    To become a “Super Node,” participants must lock up a minimum of 50 million $WLFI. In return, holders would receive priority access to partnership discussions with the platform’s leadership, though commercial agreements remain subject to separate review.

    The proposal will be put to a seven-day vote and must secure participation from at least one billion eligible tokens to be valid.

    Staking-based governance models have gained traction across decentralized finance projects as developers seek mechanisms to align long-term incentives without relying on centralized oversight.

  • Jane Street Speculation Renews Scrutiny of Bitcoin ETF Market Mechanics

    Jane Street Speculation Renews Scrutiny of Bitcoin ETF Market Mechanics

    Bitcoin’s Wednesday rally has reignited debate over the role of Wall Street market makers in spot Bitcoin exchange-traded funds, after online speculation linked the price move to a lawsuit involving quantitative trading firm and liquidity provider Jane Street.

    Posts circulating on X claimed that Bitcoin’s roughly 10% climb over two days coincided with the disappearance of a purported intraday selling pattern, suggesting that legal action against Jane Street had altered market behaviour.

    Analysts and ETF specialists, however, said the focus on a single firm obscures a more complex set of market mechanics underlying how spot Bitcoin ETFs operate.

    Bitcoin ETFs track the asset’s spot price, but the creation and redemption process allows institutional middlemen to meet demand without having to buy or sell Bitcoin on public exchanges.

    Jeff Park, chief investment officer at ProCap and an adviser to ETF issuer Bitwise, said Wednesday the debate reflects a misunderstanding of ETF market structure rather than evidence of manipulation.

    In a screenshot post on X, Park outlined how large trading firms responsible for creating and redeeming ETF shares, known as authorized participants, operate under regulatory exemptions that allow them to meet ETF demand without mechanically forcing immediate spot Bitcoin purchases.

    Park said those exemptions, which apply to all authorized participants, are designed to support orderly ETF market-making, but can create a “grey window” in which ETF share creation, hedging activity, and spot market transactions are not tightly linked in time.

    As a result, ETF inflows do not always translate into immediate buying pressure in the spot Bitcoin market, weakening the assumption that ETF demand directly maps to spot price movements.

    Ryan McMillin, chief investment officer at crypto fund manager Merkle Tree Capital, told Decrypt the structure also creates incentives that favour derivatives over spot markets.

    Because Bitcoin futures frequently trade at a premium to spot prices in a condition known as contango, authorized participants may hedge exposure using futures while earning carry from the basis, he said.

    “ETF assets under management balloons without forcing exchange buys, muting rallies below key levels where hype would otherwise push prices higher in a flywheel,” McMillin said.

    McMillin added that when futures positions are reduced, either due to macro shifts or narrowing spreads, the adjustment can amplify price swings, contributing to sharp pullbacks that appear sudden to retail investors.

    Both analysts stressed that the behaviour is legal and consistent with how ETFs are designed to operate, and does not imply wrongdoing by any individual firm.

    Instead, they said it highlights how Bitcoin’s price discovery is increasingly shaped by institutional trading venues such as futures markets, rather than spot exchanges alone.

    “APs wield hedge-fund-like incentives and tools with less accountability in a volatile, adoption-stage asset,” McMillin said. “The ETF ‘innovation’ risks becoming a yield-skimming machine for Wall St. that prioritises institutional arbitrage over genuine spot support.”

  • Ethereum Undervalued, Bitcoin & XRP Remain Neutral Amid Recent Bullish Reversal

    • MVRV shows $ETH is mildly undervalued, while $BTC, $XRP, and Chainlink remain neutral.

    • The crypto market is now witnessing an upward trend reversal despite recent bearish trends.

    • Buyers show renewed interest in crypto following Nvidia earnings report.

    Based on the 30-day Market Value to Realized Value (MVRV) Ratio, Ethereum ($ETH) is mildly undervalued at -5.5%. Bitcoin ($BTC), $XRP ($XRP), and Chainlink ($LINK) remain neutral at -1.4%, -0.1%, and +3.3%, respectively. By contrast, Cardano (ADA) is mildly overvalued, with an MVRV ratio of +6.8%.

    Source: Santiment

    Bitcoin and the wider crypto market showcase a bullish trend reversal

    The past day has seen an upward trend reversal in the broader cryptocurrency ecosystem, despite recent bearish momentum and sentiment.

    Data shows that the average Moving Average Convergence Divergence (MACD) indicator has slightly surpassed its 9-day average, indicating a weak bullish momentum reversal.

    $BTC was up 7.78% in the past day to trade at $69,050 as $ETH gained 13.31% to reclaim its $2,000 psychological level. Meanwhile, $XRP and $LINK gained +9.37% and 16.07%, respectively. Uniquely, Cardano has experienced a striking 20.07% upsurge to trade at $0.3115.

    Source: CoinMarketCap

    Events leading up to the recent crypto rally

    Tech company Nvidia recently reported record-breaking earnings driven by demand in artificial intelligence (AI). Due to the strong correlation (98%) of crypto with the S&P 500, the news fueled renewed risk appetite in investors of both stocks and crypto.

    Capital rotation from $BTC to altcoins has contributed to their recent rallies as investors seek higher returns from riskier assets. Bitcoin dominance is now at 58-60%, while the Altcoin Season Index reads 34/100, indicating a mixed market for Bitcoin and Altcoins.

    This week, Bitcoin ETFs saw $257.7M in net inflows, effectively ending a five-week outflow streak.

    Near-term market outlook

    At press time, the overall crypto market cap totaled $2.38 trillion, having gained 7.50% in the last 24hours.

    Should the current rally hold, the crypto market could test the $2.59T (50% Fibonacci) level. Falling below $2.35T (78.6% Fib) would indicate a loss in momentum, validating a weak bullish theory.

  • Ethereum Price Rally Hits Wall at $2,150 After Explosive 15% Move

    Ethereum Price Rally Hits Wall at $2,150 After Explosive 15% Move

    Ethereum price started a major rally above the $2,000 resistance. $ETH is now correcting gains from $2,150 and might decline to $2,000.

    • Ethereum started a fresh upward move above the $1,950 zone.
    • The price is trading above $2,000 and the 100-hourly Simple Moving Average.
    • There was a break above a bearish trend line with resistance at $1,920 on the hourly chart of $ETH/USD (data feed via Kraken).
    • The pair could start a fresh decline if it stays below the $2,120 zone.

    Ethereum Price Rallies Over 15%

    Ethereum price managed to form a base and traded above the $1,920 resistance, like Bitcoin. $ETH price rallied above the $2,000 and $2,020 resistance levels.

    There was a break above a bearish trend line with resistance at $1,920 on the hourly chart of $ETH/USD. The bulls even pumped the price above $2,100. A high was formed at $2,158 before there was a sharp downside correction. The price dipped below the 23.6% Fib retracement level of the upward move from the $1,792 swing low to the $2,158 high.

    Ethereum price is now trading above $2,000 and the 100-hourly Simple Moving Average. If the bulls remain in action above $2,000, the price could attempt another increase. Immediate resistance is seen near the $2,080 level.

    The first key resistance is near the $2,120 level. The next major resistance is near the $2,150 level. A clear move above the $2,150 resistance might send the price toward the $2,200 resistance. An upside break above the $2,200 region might call for more gains in the coming days. In the stated case, Ether could rise toward the $2,250 resistance zone or even $2,320 in the near term.

    Another Drop In $ETH?

    If Ethereum fails to clear the $2,120 resistance, it could start a fresh decline. Initial support on the downside is near the $2,000 level. The first major support sits near the $1,975 zone or the 50% Fib retracement level of the upward move from the $1,792 swing low to the $2,158 high.

    A clear move below the $1,975 support might push the price toward the $1,930 support. Any more losses might send the price toward the $1,900 region. The main support could be $1,880.

    Technical Indicators

    Hourly MACDThe MACD for $ETH/USD is losing momentum in the bullish zone.

    Hourly RSIThe RSI for $ETH/USD is now above the 50 zone.

    Major Support Level – $1,975

    Major Resistance Level – $2,150

  • IMF: US Inflation Won’t Hit Fed Target Until 2027, Delaying Rate Cuts

    IMF: US Inflation Won’t Hit Fed Target Until 2027, Delaying Rate Cuts

    The International Monetary Fund said Wednesday that US inflation will not return to the Federal Reserve’s 2% target until early 2027.

    The assessment, part of the IMF’s first Article IV review of the Trump administration, signals that meaningful rate relief remains distant despite the president’s optimism.

    IMF Flags Fiscal Risks

    IMF Managing Director Kristalina Georgieva told reporters the US current account deficit is “too big.” The Fund estimates it at 3.5% to 4% of GDP in the near term.

    But the IMF’s prescription clashes with the administration’s approach. Nigel Chalk, the Fund’s Western Hemisphere Director, said fiscal consolidation — not tariffs — is the best path to narrowing the deficit. The recommendation comes after the Supreme Court struck down Trump’s broad emergency tariffs as illegal, forcing the administration to invoke Section 122 of the Trade Act of 1974 for replacement levies.

    The fiscal picture is stark. The IMF projects US federal deficits will remain between 7% and 8% of GDP in the coming years. That is more than double the levels targeted by Treasury Secretary Scott Bessent. Consolidated government debt is on track to reach 140% of GDP by 2031.

    “The upward path for the public debt-GDP ratio and increasing levels of short-term debt-GDP represent a growing stability risk to the US and global economy,” the Fund warned.

    Trump’s Rate Optimism vs. Structural Reality

    The IMF review landed one day after Trump’s State of the Union address, where the president painted a rosy picture on borrowing costs. He claimed mortgage rates had hit four-year lows and that annual mortgage costs had dropped nearly $5,000 since he took office. He framed lower rates as the solution to what he called the “Biden-created housing problem.”

    Yet the IMF’s numbers tell a different story. With inflation not reaching the Fed’s target until 2027 and fiscal deficits running at twice the administration’s own goals, the structural case for higher-for-longer rates is strengthening. The Fund pegged 2026 US growth at a resilient 2.4%, leaving the Fed little urgency to ease.

    What It Means for Crypto

    The implications for risk assets are clear. Sticky inflation and an expanding fiscal deficit reduce the probability of aggressive rate cuts this year. For crypto markets, which rallied on rate-cut expectations through late 2025, the IMF’s assessment reinforces caution.

    The deeper irony is that the administration’s own fiscal expansion — including what the IMF notes are historically large tax cuts — is the primary driver of the deficit that keeps rates elevated. Trump wants lower rates but is pursuing policies that structurally prevent them.

    The IMF stopped short of predicting a crisis, noting that “the risk of sovereign stress in the US is low.” But the trajectory it describes — rising debt, persistent deficits, delayed disinflation — points to an environment where rate relief comes slowly, if at all.

    The post IMF: US Inflation Won’t Hit Fed Target Until 2027, Delaying Rate Cuts appeared first on BeInCrypto.