Tag: CRYPTOS FoxBusiness

  • Shiba Inu price prediction for October

    Shiba Inu price prediction for October

    $SHIB’s Solana launch adds a new trading venue

    Sunrise announced $SHIB’s availability on Solana on Oct. 4, with the official Shiba Inu and Solana accounts also confirming the launch, according to Solana Compass. The analytics platform reported that the token became tradable through services including Raydium, Jupiter, and Phantom.

    Solana Compass recorded 3,005 trades worth approximately $300,000 across 1,401 wallets during a five-minute window shortly after the announcement. Its early figures also showed about $514,000 in pool liquidity.

    The launch gives $SHIB another venue for trading as its daily chart tests resistance. Nevertheless, the price recovery visible on TradingView began before the Oct. 4 announcement, with the token already climbing from its summer base through August and September.

    For U.S. holders following the October setup, the technical reference here is Binance’s $SHIB/$USDT market. Its quoted levels reflect that trading pair, while execution prices on other exchanges or Solana trading venues may differ.

    Shiba Inu holds above four daily moving averages

    The daily TradingView chart shows the 20-day simple moving average at $0.00000571 and the 50-day average at $0.00000541. The 100-day average stands at $0.00000494, while the 200-day average sits at $0.00000530.
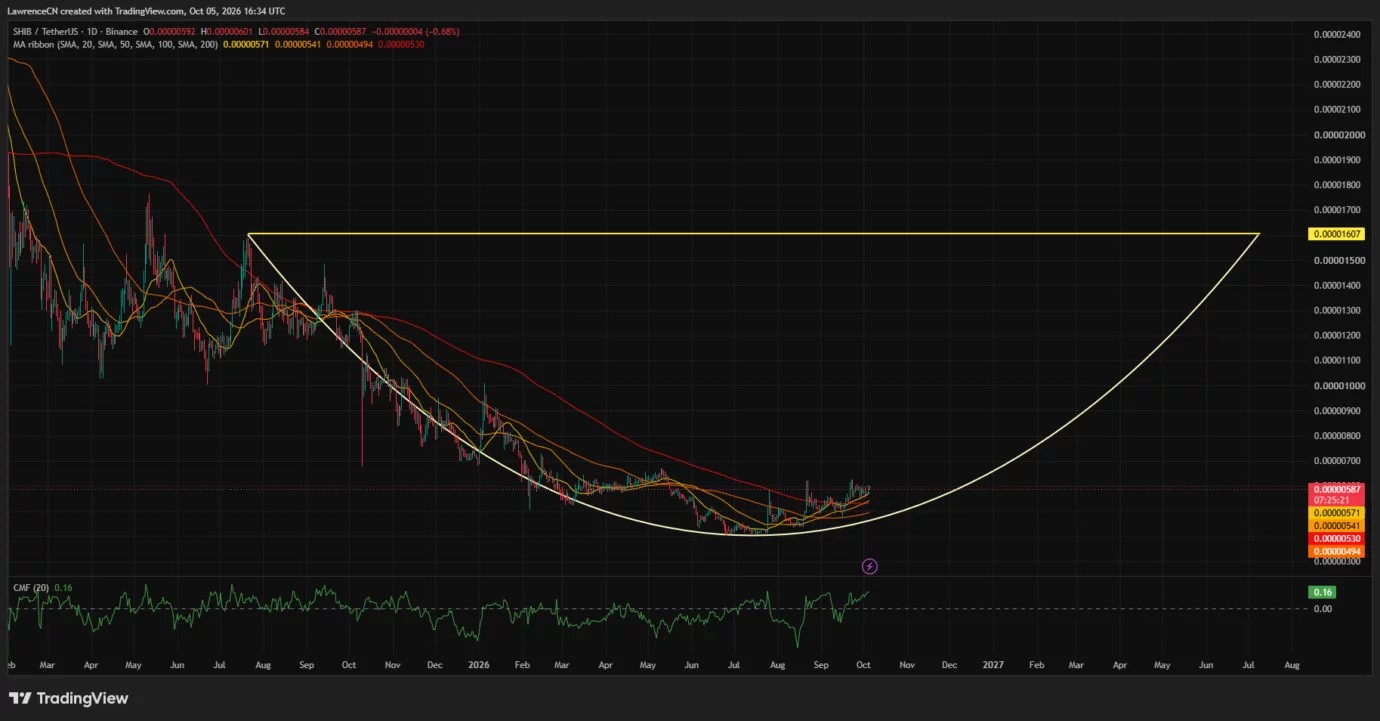
    Shiba Inu price daily chart — Oct. 5 | Source: TradingView

    At $0.00000587, $SHIB trades approximately 2.8% above its 20-day average. The relatively small gap makes $0.00000571 the first moving-average level to watch if the token retreats from resistance.

    Below that level, the 50-day and 200-day averages form a second reference zone between $0.00000530 and $0.00000541. A pullback into that area would surrender more of the recent advance and place price back among its longer-term trend measures.

    The averages have not yet formed a fully bullish sequence. Although the 20-day average sits above the other three, the 100-day average remains below the 200-day average, reflecting the earlier decline.

    Daily Chaikin Money Flow reads 0.16. Its positive reading supports the improving daily setup, although a sustained advance would still require price to clear the nearby highs.

    The daily chart also contains a broad curved annotation running from the July 2025 peak, through the 2026 base, toward a horizontal level at $0.00001607. That level is roughly 174% above the latest price and belongs to a much larger potential recovery structure.

    For October, the nearer $0.00000600–$0.00000630 area takes priority. $SHIB would need to overcome those levels before the distant upper boundary becomes relevant to the immediate outlook.

    Weekly resistance at $0.00000596 remains the first hurdle

    The weekly TradingView chart places $SHIB just below a Murrey Math resistance level at $0.00000596. The latest price is approximately 1.5% beneath that threshold, which closely overlaps the daily resistance area around $0.00000600.
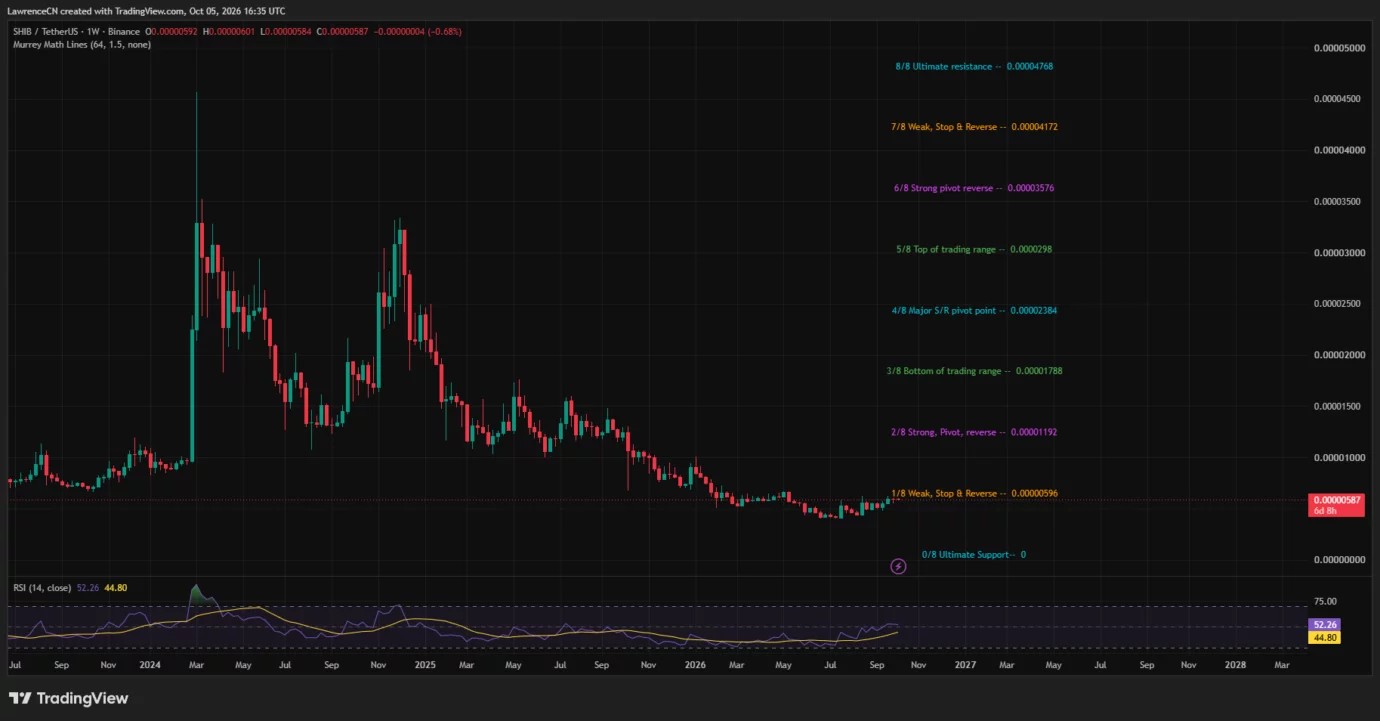
    Shiba Inu weekly price chart — Oct. 5 | Source: TradingView

    Weekly RSI stands at 52.26, above the neutral 50 line and its displayed average of 44.80. The reading marks firmer momentum than during the earlier decline, while remaining below the conventional overbought threshold of 70.

    Price and momentum therefore present slightly different stages of recovery: RSI has moved above its midpoint, while $SHIB continues to test its first nearby weekly resistance.

    A sustained move above $0.00000596–$0.00000600 would strengthen the near-term bullish case. Repeated rejection there would leave the token trading close to the same ceiling despite its improving indicators.

    On X, market commentator Terrarmy described a potential daily ascending triangle and rising support on the 4-hour timeframe. The account also pointed to a possible test of longer-term descending resistance.

    🔥🐕 $SHIB THE BIGGEST BREAKOUT COULD BE AHEAD! 🚀

    Something interesting is forming on the $SHIB charts.

    4H Chart: An ascending support trendline is forming, with price approaching a key resistance zone.

    1D Chart: A potential ascending triangle structure is developing. A… pic.twitter.com/DfXv93hf11

    — Terrarmy 🐋 (@terra_army) October 4, 2026

    Terrarmy tied the bullish scenario to breakouts backed by strong volume and acknowledged the possibility of failed breakouts or support losses. The October outlook therefore remains conditional on $SHIB clearing resistance while preserving its recent higher lows.

    October targets cluster around $0.00000610–$0.00000630

    CoinGlass’s one-month liquidation heatmap shows overhead concentrations around $0.00000610 and $0.00000630. Both sit above the immediate $0.00000596–$0.00000600 resistance zone.
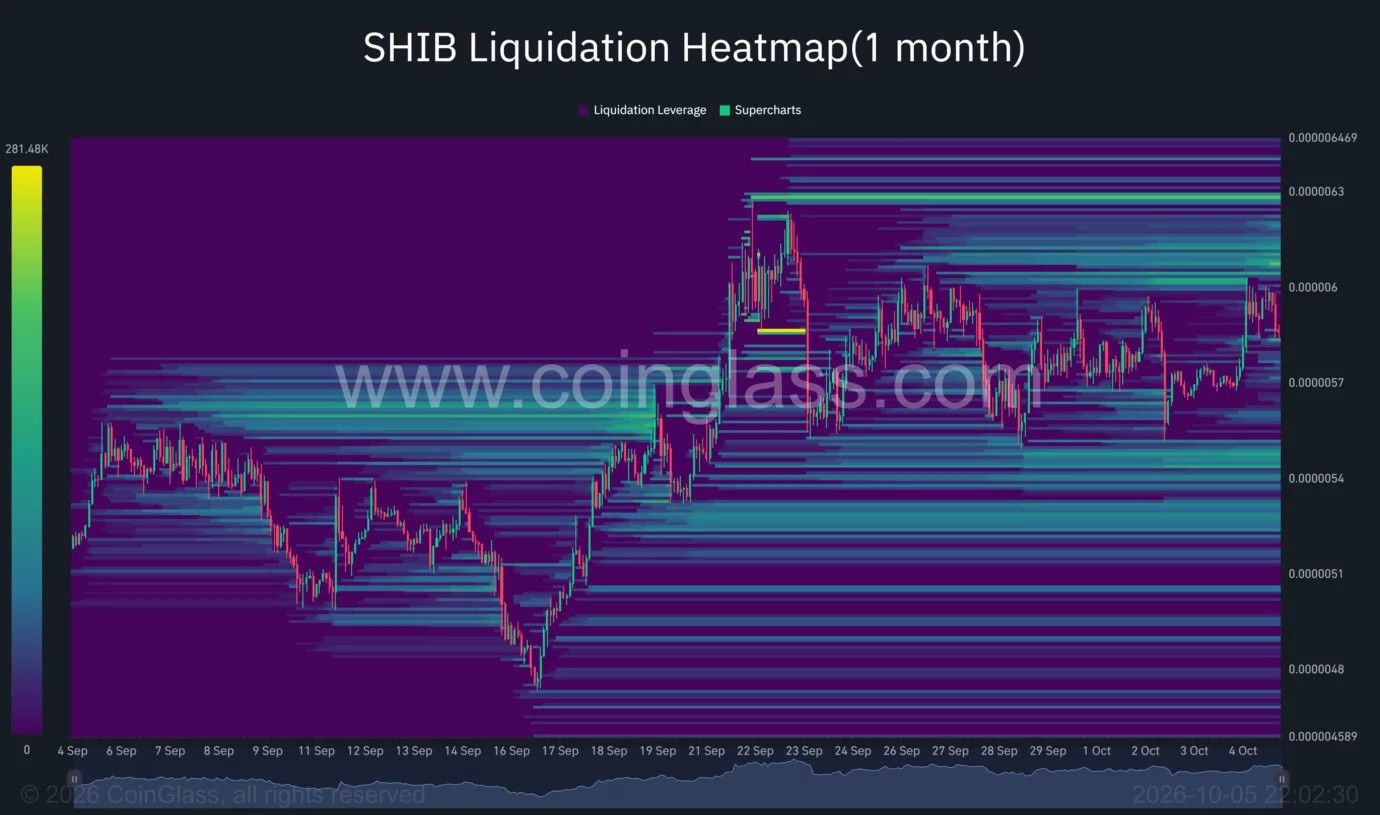
    Shiba Inu liquidation heatmap | Source: CoinGlass

    If $SHIB clears that first barrier and holds above it, $0.00000610 becomes the next nearby upside reference. The higher $0.00000630 area also lies close to the September peak visible on the heatmap.

    From $0.00000587, moves to $0.00000610 and $0.00000630 would represent gains of approximately 3.9% and 7.3%, respectively. Reaching the upper zone would require $SHIB to push beyond several recent highs.

    Below current prices, the heatmap shows liquidation concentrations around $0.00000545–$0.00000550 and another band near $0.00000530. Those areas broadly overlap the support region identified by the daily moving averages.

    The short-term bullish scenario holds while $SHIB preserves its daily support and breaks through $0.00000600. A loss of $0.00000571 would put the lower $0.00000545–$0.00000550 area in focus, followed by $0.00000530–$0.00000541.

    October’s immediate test is whether $SHIB can turn the $0.00000596–$0.00000600 ceiling into support. Until that happens, the charts show an improving recovery, with resistance still close overhead.

  • Solana ETF inflows collapsed 99% but SOL holds firm: what are bulls seeing

    ETF inflows drop nearly 99%

    Solana-focused ETFs recorded $2.43 million in net inflows last week, according to CoinGlass data.

    That compares with $188.22 million the previous week—a decline of approximately 98.7%. Although the funds extended their positive streak to 14 consecutive weeks, the latest total shows a substantial reduction in fresh allocations.

    The distinction is important: demand slowed sharply, but the funds did not experience a net weekly withdrawal.

    The figures suggest ETF buying offered much less support than during the preceding week. Whether that represents a temporary pause or a more persistent slowdown will depend on subsequent flows.

    ETF activity also captures only one channel of $SOL investment. It does not provide a complete measure of buying and selling across exchanges, decentralized markets, and other investment vehicles.

    Solana’s network continued showing signs of active usage despite softer ETF inflows.

    According to SolanaFloor, the network’s decentralized exchange volume on Sunday exceeded the combined volume of Ethereum mainnet, Ethereum Layer-2 networks and Hyperliquid.

    The comparison highlights strong activity during that session, although one day’s performance does not establish a lasting lead.

    The platform also cites more than $4.4 billion in tokenized-stock trading volume on Solana. That points to growing activity around blockchain-based exposure to traditional equities.

    The supplied figures do not specify the measurement period for that total. It should therefore be distinguished from the Sunday DEX comparison rather than treated as a daily reading.

    Together, the reports support a picture of continued ecosystem participation, even as investment through ETFs moderates.

    Solana technical forecast: Triangle pattern keeps breakout levels in focus

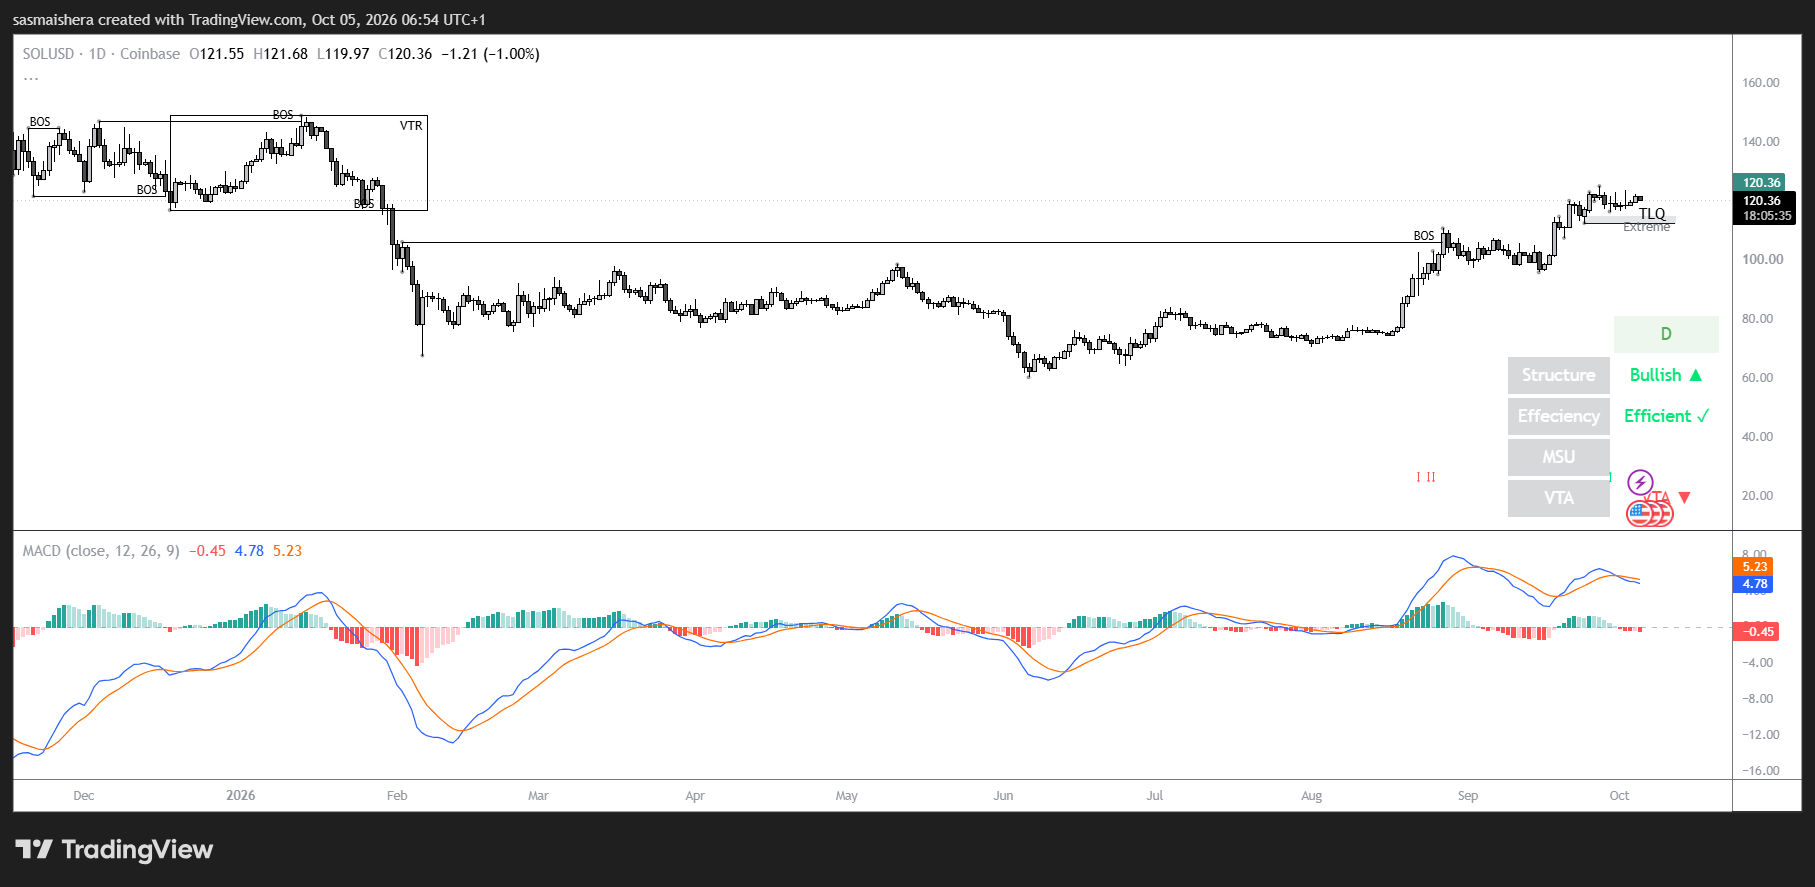
    On the four-hour and daily charts, $SOL remains above its 50-, 100-, and 200-period exponential moving averages, positioned around $119.24, $116.43, and $110.44.

    A rising support trendline near $119.16 and overhead resistance around $123 form the triangle. This narrowing structure suggests price is consolidating between nearby buying and selling levels.

    The pattern alone does not determine which direction the eventual breakout will take.

    Daily momentum remains constructive. The Relative Strength Index is near 54, while the Moving Average Convergence Divergence indicator is mildly positive.

    Those readings favor a modest bullish bias rather than an especially strong momentum surge.

    The immediate upside hurdle is the resistance trendline around $123, followed by September’s high at $124.95.

    A confirmed move above both levels would strengthen the case for extending the recovery. The Fibonacci projection places the next potential target at $132.87.

    That target remains conditional on a successful breakout. A brief move above resistance followed by a reversal would provide weaker confirmation than sustained trading above the cluster.

    Initial support is concentrated between approximately $118.71 and $119.25.

    That area combines a Fibonacci level, the rising trendline, and the 50-period EMA. Holding it would help preserve the short-term recovery structure.

    A decisive break below the cluster would bring the 100-period EMA near $116.43 into focus. The 200-period EMA around $110.44 sits further below.

    For now, $SOL’s technical bias remains mildly bullish, but its next move depends on whether buyers defend nearby support and generate enough demand to overcome resistance.

  • “What the Hell Else Can I Do?”—Cardano Founder Defends ADA Progress

    “What the Hell Else Can I Do?”—Cardano Founder Defends ADA Progress

    Hoskinson rejected that argument, noting that $NIGHT itself was issued on Cardano and asking why a project built from the Cardano ecosystem should be viewed as harmful to it.

    The stupidity is strong here. Apparently, launching a project on Cardano is bad for Cardano. Tell me where is night the issued. What was the first CNA to be listed on Binance? What wallets do people use to manage their night?

    If this is how Cardano treats the people building on… https://t.co/j2x0TvJl63

    — Charles Hoskinson (@IOHK_Charles) October 3, 2026

    Another critic went further, comparing Hoskinson to a “used car salesman” and pointing to what he described as weak liquidity, stablecoins, and DEX volume.

    He also accused Hoskinson of blaming $ADA holders rather than developers when the ecosystem struggles.

    Charles starting to sound like a used car salesman. If the cars broken, it’s your problem. Low liquidity, no stablecoins, no DEX volume. $ADA holders are aways the issue with him never the DEVs. We’ve been taken for a ride full circle. Most people just want their money back.

    — Kash_the_Kreator (@Nikkash4) October 4, 2026

    Hoskinson Points to RealFi, Midnight and New Integrations

    Hoskinson responded with a list of projects that have moved forward this year.

    Explain what I should do differently. We just launched RealFI; Pogun is on the way; we launched Midnight; and now we have Midnight. city. We did the Pentad that brought LayerZero, Fireblock, Pyth, Circle, and other integrations to Cardano. We have Draper and Alphagrowth. All…

    — Charles Hoskinson (@IOHK_Charles) October 4, 2026

    RealFi went live on Cardano mainnet on Oct. 1, following months of public testing. Midnight, meanwhile, launched its network in March, while $NIGHT had already launched as a Cardano Native Asset in December 2025.

    Midnight.city is also operating in open beta as an AI-focused application tied to the wider Midnight ecosystem.

    He also mentioned Pogun, a Bitcoin-focused DeFi project covering credit, yield and bridging. Its 12.29 million $ADA treasury request failed to secure enough support in September, although Hoskinson has continued to say the project is moving ahead.

    Then there is the Pentad’s infrastructure push. USDCx and Pyth have gone live, LayerZero is being rolled out in phases, and Fireblocks announced plans to add full support for Cardano Native Tokens.

    Cardano Now Has to Turn Development Into Usage

    This is where the criticism becomes measurable.

    Cardano currently has about $68.3 million in DeFi TVL and $67.2 million in stablecoins, so the claim that it has “no stablecoins” or DEX activity is not literally accurate. DEXs processed about $4.05 million over 24 hours and $41 million over seven days, with weekly volume up 133%. The network also recorded roughly 18,964 active addresses and 34,905 transactions over 24 hours.

    Those numbers show activity, but they also provide the benchmark against which Hoskinson’s recent launches can now be judged.

    The Crypto Basic previously reported that Hoskinson believes RealFi could become a major driver of Cardano TVL and eventually help push it toward $1 billion. With RealFi only reaching mainnet this week, that thesis has now moved from development promises to something that can be measured against actual deposits and usage.

  • Standard Chartered Draws Attention to Four Altcoins! Price Targets Revealed! Here Are the Details

    Standard Chartered Draws Attention to Four Altcoins! Price Targets Revealed! Here Are the Details

    Speaking to Milk Road Crypto, Geoffrey Kendrick stated that he believes a new era will begin in the crypto market as traditional finance moves onto blockchain networks.

    Kendrick stated that the tokenization trend is not a temporary phenomenon and has now become permanent, adding that four altcoins in particular could significantly benefit from this transformation: $UNI, $MORPHO, $AAVE, and $ARB.

    According to Kendrick’s assessment, institutional investors moving their real-world assets onto the blockchain could accelerate the growth of the DeFi ecosystem.

    At this point, the bank had previously predicted that the total value of tokenized assets on-chain could reach $4 trillion by the end of 2028. Of this, $2 trillion is expected to come from stablecoins and $2 trillion from real-world assets.

    Uniswap Has a $100 Target!

    The bank had previously stated a $100 target for $UNI in its analyses. However, Kendrick believes that even the previously announced $100 target for Uniswap by 2030 may be too low. According to the analyst, the platform’s strong liquidity network and the redirection of transaction fees to the token buyback and burning mechanism could support $UNI’s appreciation in value.

    Aave and Morpho Take Center Stage!

    Kendrick considers Aave one of the leaders in the on-chain banking system and projects a target of $3,500 for $AAVE by the end of 2030. For Morpho, he set a target of $60. According to the analyst, unlike Aave, Morpho has growth potential, particularly in the on-chain asset management sector.

    Arbitrum May Be the Biggest Bet!

    Among the four projects, one of Kendrick’s most ambitious predictions came for Arbitrum. The analyst believes $ARB could reach $10 by 2030. He bases this prediction on Robinhood Chain’s use of Arbitrum technology and the revenue it generates for Arbitrum.

    *This is not investment advice.

  • ZAMA crypto hits new TVL high of $99M as futures participation accelerates – Details

    ZAMA crypto hits new TVL high of $99M as futures participation accelerates – Details

    Source: TradingView

    Record TVL signals growing network adoption

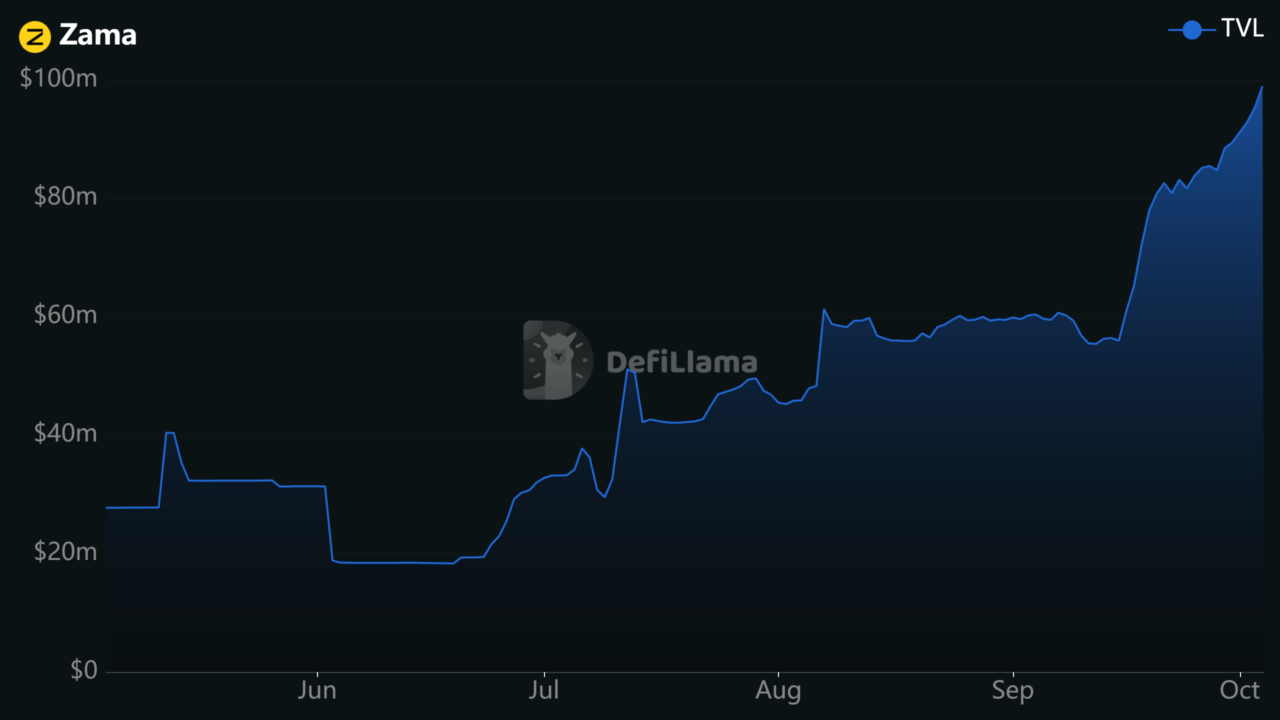
    One of the biggest factors standing out behind the latest advance is the continued growth of the $ZAMA ecosystem.The network’s Total Value Locked (TVL) has climbed to a new all-time high at $99 million, indicating that more capital is being committed to the protocol.

    Moreover, growth across Morpho vault expansion and Zama Swap has contributed to the increase, pointing to improving ecosystem usage and stronger investor confidence.

    Source: DeFiLlama

    Derivatives activity supports the breakout

    Besides the position long-term and holders sentiments, market participation has also strengthened across both spot and derivatives markets.

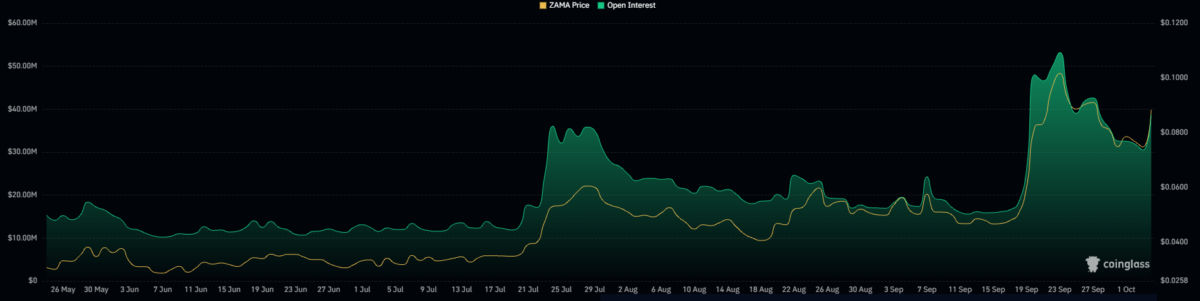
    The network’s open Interest has spiked by more than 29% to $38.71 million. This suggests fresh capital is entering the futures market. As a result, traders position for further bullish advances.

    Source: CoinGlass

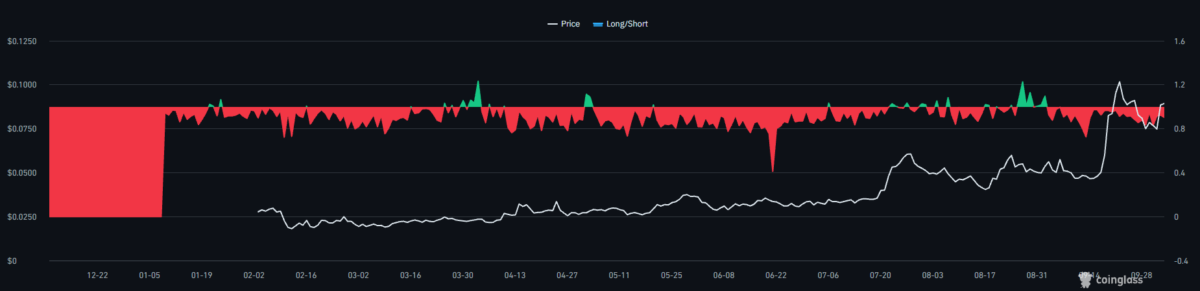
    Among the open leveraged positions short slightly have the upper hand. At the time of writing , the token’s long/short ratio stood at 0.94.

    Source: CoinGlass

    Despite the cautionary signals from the shorts’ slight dominance, both spot and futures trading volumes surged by more than 100% over the past 24 hours, highlighting broad-based demand from different classes of market participants.

    The network spot volume had surged by 140% to $115 million while its spot volume surged by 140% to $65 million.

    Source: CoinGlass

    Can $ZAMA reclaim $0.108?

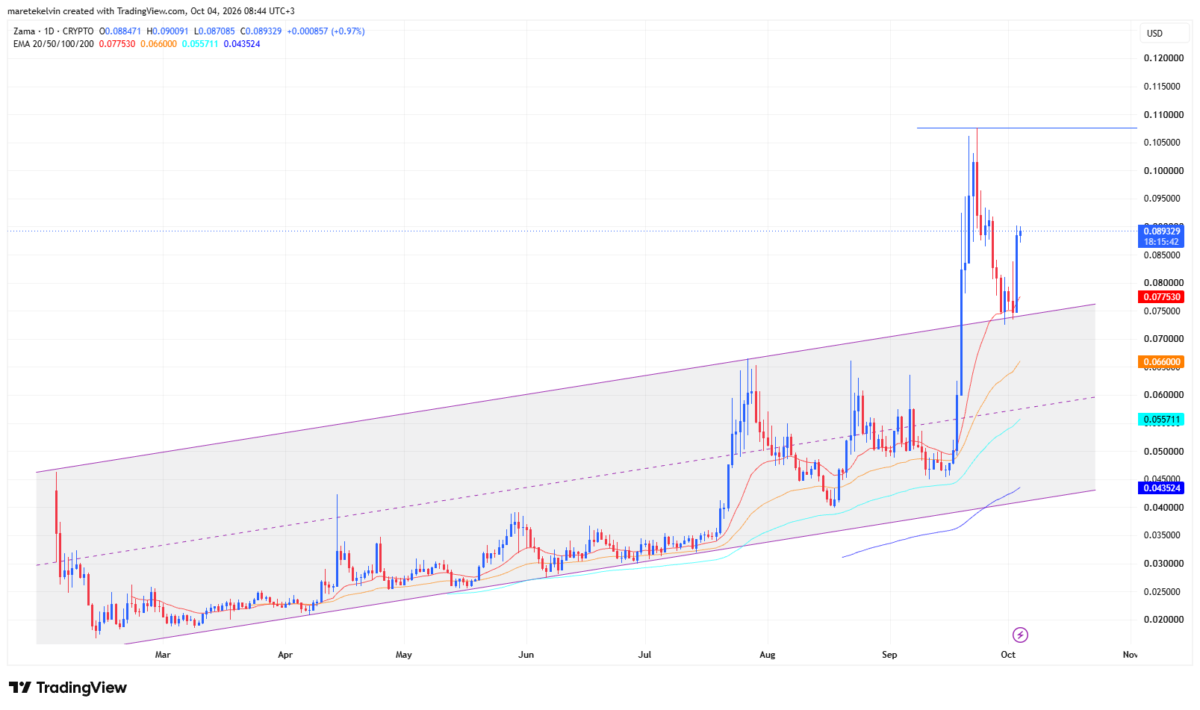
    On the daily chart, the next major technical objective for bulls sits around the $0.108 swing high. A continued expansion in TVL, sustained growth in Open Interest and elevated trading activity could provide the momentum needed for buyers to challenge that level.

    However, after a rapid 17% advance, a short-term profit-taking before the next bullish push could be on cards. This is more so given that short dominance among the leveraged position giving a hint.

    All in all, the long term structure leans to the bulls favor and most fundamentals and on-chain metrics support an extended bullish momentum in the long run.

  • Will Near Protocol (NEAR) Rally Continue? Key Reversal Spotted

    Will Near Protocol (NEAR) Rally Continue? Key Reversal Spotted

    $NEAR/USDT Chart by TradingView

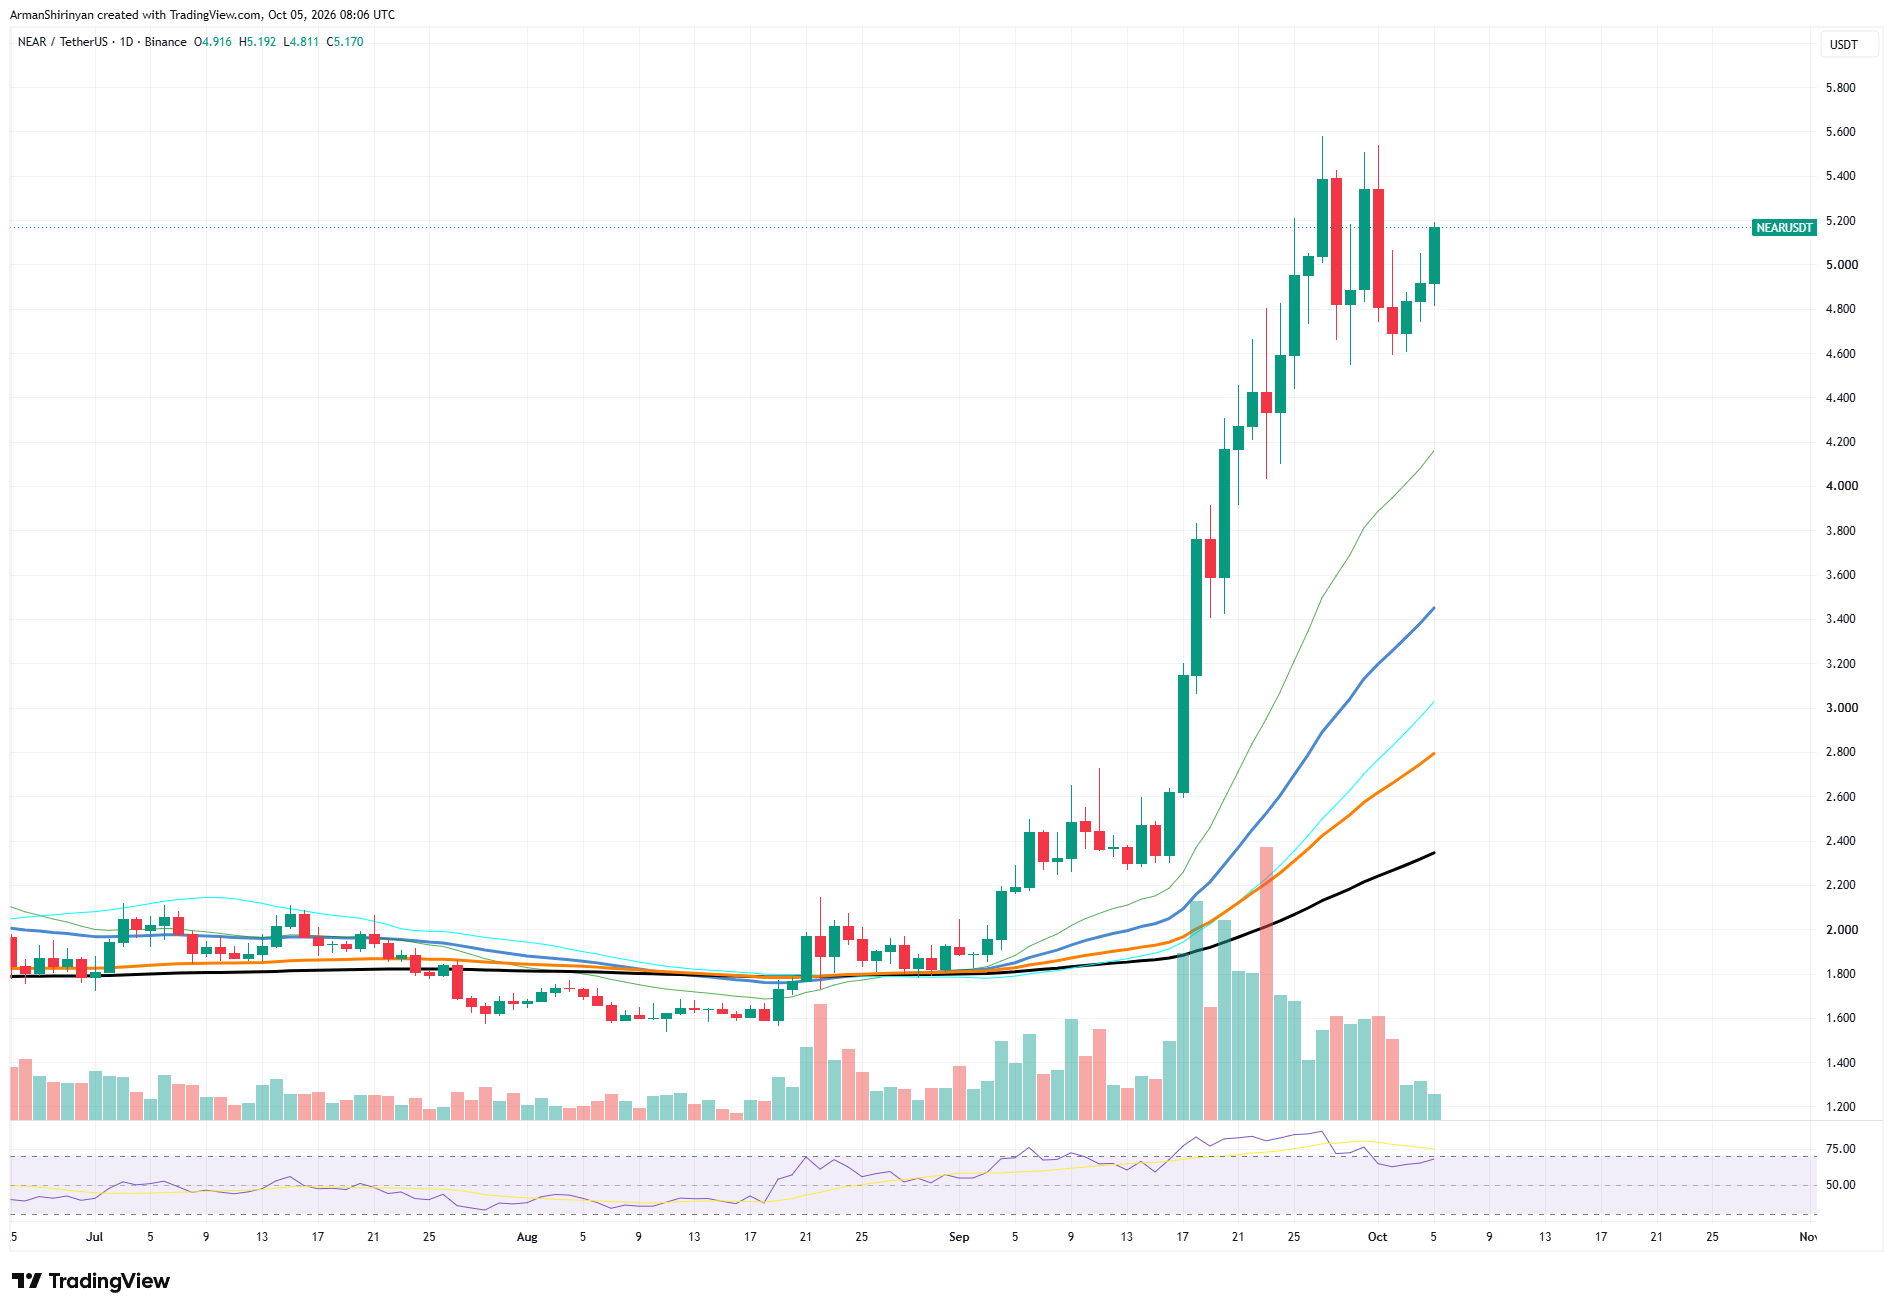
    Such a breakout could reopen the path toward $6.00 and potentially extend the current price-discovery phase.

    Momentum remains elevated but has cooled from extreme conditions. The daily RSI previously pushed into overbought territory above 70 during the vertical portion of the rally. It has since retreated before beginning to turn upward again. This reset is constructive because $NEAR managed to reduce its momentum excess without giving back most of the gains from the September advance.

    Heavy Long-Term Trend Extension

    The moving-average structure also remains strongly bullish. Price trades far above all major averages, while the shorter-term averages continue rising rapidly. The downside is that $NEAR remains heavily extended from its longer-term trend, increasing the probability of violent corrections even if the broader uptrend survives.

    For now, $4.60 is the critical support level. Losing that level would weaken the latest reversal and expose approximately $4.20, followed by the rapidly rising short-term moving average. Conversely, holding above $5.00 and breaking $5.60 would confirm that buyers have regained control.

    $NEAR‘s rally therefore does not appear technically exhausted yet. But after a move of more than 200% from the August lows, continuation increasingly depends on converting the $5.40–$5.60 supply zone into support rather than simply maintaining bullish momentum.

  • Major XRP Signal: Peter Brandt Reveals Cup and Handle

    Major XRP Signal: Peter Brandt Reveals Cup and Handle

    The subsequent recovery is what makes Brandt’s chart interesting. $XRP rebounded rapidly toward $1.60–$1.65 and has since moved sideways around $1.50. This consolidation could potentially serve as the “handle” portion of the formation, although confirmation remains absent while $XRP trades below Brandt’s $1.6572 resistance.

    The daily chart provides some support for the bullish interpretation. $XRP remains comfortably above its major moving averages, including short-term support around $1.45 and a cluster of longer-term averages around $1.35–$1.40. The earlier descending trend line has also been broken, removing one of the major technical barriers that constrained $XRP throughout September.

    Momentum is relatively healthy. The RSI sits in neutral-to-bullish territory rather than returning to the heavily overbought state seen during the August breakout. That gives buyers some room if another growth period starts.

    $XRP rises again

    However, $1.65–$1.66 remains the decisive barrier. $XRP has already produced several upper wicks around this area, indicating that sellers remain active. A convincing daily breakout above $1.6572 would strengthen the cup-and-handle interpretation and could put the August high around $1.70 back into focus. Beyond that, the psychological $2.00 level would become increasingly relevant.

    Failure to break resistance would leave $XRP trapped inside its current range. Initial support sits around $1.48–$1.50, followed by approximately $1.45. Losing those levels could invalidate the developing handle and expose the $1.35–$1.40 region.

    For now, Brandt’s cup reference looks less like a confirmed signal and more like a setup awaiting its trigger: $1.65.

  • Bitcoin is about to get a major bullish signal it hasn’t had in over a year

    Bitcoin is about to get a major bullish signal it hasn’t had in over a year

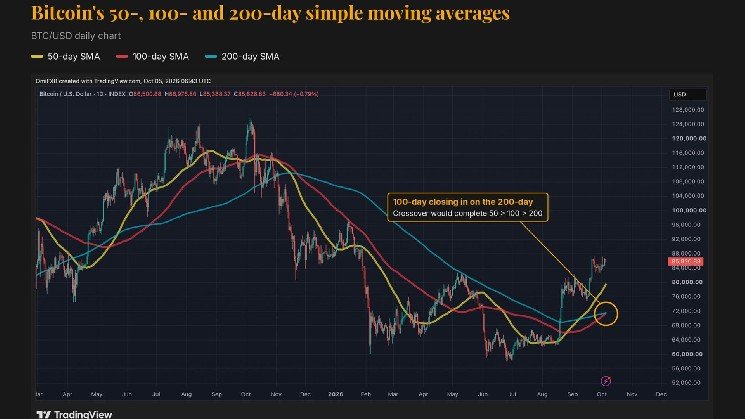
    The impending signal, therefore, suggests that bitcoin’s price recovery over the past three months is real. The token’s price has surged by more than 40% to $87,000 during the third quarter. Lately, the ascent has stalled at around $85,000 amid a sustained uptrend in the U.S. Dollar Index.

    “To state a fact, the latest signal confirms the recovery has endured,” Subburaj said.

    Some of the past alignments have marked the start of major rallies. One formed on Oct. 27, 2020, when $BTC traded around $13,600, and held until May 2021. By then, bitcoin had hit a then-record high above $64,000. Another, confirmed in early November 2023, stayed intact until May 2024, during which bitcoin more than doubled from roughly $35,000 to $73,000.

    Others have been far less rewarding. The bullish alignment that formed in June 2025 lasted 97 days, but bitcoin gained only modestly, rising from about $106,000 to $112,000. A similar set-up in June 2024 lasted just 20 days, and bitcoin fell about 10%.

    “The crossover strengthens the trend case, but it does not guarantee its continuation,” Subburaj said. “The asset’s price behaviour afterwards will determine whether it becomes a sustained bull-market structure or another short-lived alignment.”

    He explained that the real test now is whether bitcoin’s spot price can continue to stay above its 50-day average.

    “The more consequential test is whether Bitcoin can hold the 50-day average during a correction,” he said.

  • Ethereum has a 25-day wait to start staking, with nearly 1.5 million ETH in line

    Ethereum has a 25-day wait to start staking, with nearly 1.5 million ETH in line

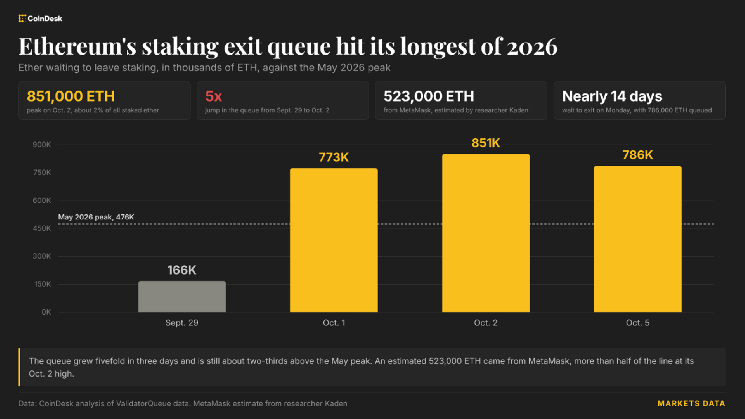
    Demand to start staking has been cooling separately. About 1.5 million $ETH, worth roughly $4 billion, was waiting to enter on Monday, with an estimated wait of roughly 25 days, down from about 2 million $ETH and a wait of about 35 days in early September.

    Most of the jump came from MetaMask. The company, best known for its cryptocurrency wallet, also runs validators for Lido, a service that pools users’ ether for staking. At the time, Ethereum security researcher Kaden estimated the precautionary exits covered roughly 17,000 validators holding about 523,000 $ETH, figures MetaMask has not confirmed.

    MetaMask disclosed a security incident on Sept. 30 and began taking affected validators out of service. An Oct. 1 update said its investigation had found no indication that wallets or customer funds had been affected.

    That makes most of the exit queue a temporary detour for one operator’s coins. Lido expects the ether to return gradually as the affected validators leave, their balances are withdrawn and the coins enter staking again. It estimated the whole process could take up to about 45 days, with affected validators missing rewards while they are out of service.

    “No action is required from stETH holders,” Lido said last week, referring to the token that represents users’ stake in the service.

  • Unexpected Twist in $3.8 Million Crypto Attack: Hacker Returns All the Money! Here Are the Details

    $NEAR Intents announced that the $3.8 million received during the security breach has been fully refunded. The refund came after the announcement that the attacker’s identity had been determined.

    $NEAR Intents, a cross-chain transaction infrastructure operating within the $NEAR ecosystem, announced that it has recovered all funds lost in a security incident involving approximately $3.8 million. According to a statement by the platform’s general manager, Alex Shevchenko, the individual associated with the attack returned the assets in full after the 48-hour grace period granted to them.

    The incident stemmed from a flaw in the interaction between the Omni deposit and withdrawal infrastructure and the $NEAR Intents smart contract. Following the discovery of the security issue, some services were temporarily suspended, and the team announced that affected users would be fully compensated. On-chain researcher ZachXBT reported that some of the funds related to the incident were sent to KuCoin and subsequently transferred to the Bitcoin network.