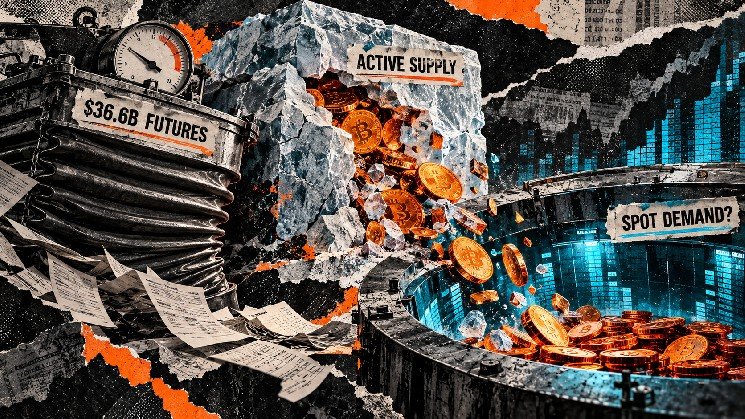
Open interest measures outstanding futures exposure, but assessing the vulnerability of those positions also requires information about account leverage and collateral.
The remaining exposure was still near the upper edge of Glassnode’s statistical range. Long-side funding payments rose from $926,400 to $1.5 million, showing that the contraction in open interest coexisted with stronger demand for bullish perpetual exposure.
How recent activity changes the risk picture
Glassnode’s March 2025 Market Pulse glossary describes Hot Capital Share over a three-month window.
Separately, its realized-cap age-band methodology values coins at the price when they last moved, and divides each band’s value by total realized capitalization. The denominator represents the combined last-movement value of the coin supply.
When older coins move, their age resets and their realized value updates, so an established holder can reactivate dormant coins and increase recent-coin economic weight. Activity alone cannot identify first-time investors or fresh fiat deposits.
The supply ratio divides short-term-holder coin supply by long-term-holder coin supply. At 14.2%, it means about 14.2 units of short-term supply for every 100 units of long-term supply.
Glassnode’s holder classification groups addresses into entities and smooths their entity-average holding-age classification around a 155-day midpoint, excluding exchange balances.
Younger cohorts tend to spend more readily during volatility. Their growing relative presence supports continued price sensitivity, while leaving the timing and direction of future spending open.
The report’s spot cumulative volume delta, the balance between buyer- and seller-initiated trades, changed from negative $102.8 million to positive $33.2 million. The measure tracks trading aggression, so its improvement indicates a shift toward buyers without quantifying new investor capital.
Whether continued demand absorbs active supply is the next test. Sustained spot buying would temper the fragility concern, while renewed taker selling alongside deteriorating holder profitability would strengthen it.
Futures exposure and holder activity therefore need to be read together. The October snapshot shows a smaller nominal derivatives footprint alongside more recently active capital, with improving spot buying providing a counterweight. Holder sensitivity remains a separate risk to watch.
This statement is significant because the growth of institutional Bitcoin reserves raises the question of whether these assets can be sold in large quantities without creating excessive market impact. With this transaction, Metaplanet aimed to demonstrate that Bitcoin reserves are not merely a passive asset held long-term, but a source of liquidity that can be used for corporate financing when needed.
The sale does not mean the company has abandoned its Bitcoin strategy. After selling 10,000 $BTC, Metaplanet bought back a larger amount of Bitcoin, increasing its total reserves. However, it was reported that the company purchased Bitcoin at a higher average cost than it sold during the buyback.
The transactions resulted in a potential tax loss that could be utilized by the US side. Whether this loss will be recognized as a deferred tax asset on the balance sheet will be determined after the audit firm’s review. Therefore, the potential tax advantage is not yet certain.
Metaplanet also reported an 11.3% return on $BTC for the third quarter. The company generated approximately 848 million yen from income activities encompassing options and other Bitcoin-related transactions. The reported $BTC return is not the same as traditional cash earnings; it is used as an institutional performance indicator measuring the change in Bitcoin holdings relative to the number of shares.
The expansion is designed to bring fiat and digital asset operations into the same platform rather than requiring institutions to use separate providers for banking, custody, trading and settlement.
Clients can access institutional USD accounts, named virtual accounts with unique routing details, SWIFT transfers and Anchorage Digital’s Atlas settlement network alongside the firm’s digital asset custody and trading services.
“Global businesses should not have to choose between the speed of digital assets and the reliability of traditional banking rails,” Anchorage Digital CEO and co-founder Nathan McCauley said.
The company said the service is aimed at global trading firms, crypto exchanges, protocols, neobanks, banks, asset managers, family offices and corporates operating across multiple markets.
The move also expands Anchorage Digital’s presence in Asia Pacific, where the company said institutional demand for digital asset infrastructure continues to grow.
Standard Chartered Global Head of Fintech Luke Boland said the partnership combines the bank’s payments and risk infrastructure with Anchorage Digital’s regulated platform to make it easier for institutional firms to manage fiat and digital assets across borders.
Anchorage Digital said the broader goal is to consolidate payments, custody, trading and settlement into a single institutional platform as traditional banking rails and blockchain infrastructure increasingly converge.
For Democrats, the higher support level is going to Steven Horsford, a Nevada lawmaker who helped get a bipartisan crypto tax bill through the House tax committee he serves on, and Derek Tran of California, Fairshake said. Both of them have an “A” rating on digital assets issues from Stand With Crypto, as does the third recipient, Janelle Bynum.
Bynum is an Oregon Democrat incumbent who had beaten Republican Lori Chavez-DeRemer for her seat two years ago. Chavez-DeRemer, who was backed by Fairshake in the prior election, went on to run President Donald Trump’s Department of Labor, though she resigned earlier this year under multiple misconduct allegations. Bynum voted for crypto bills during her first term and appeared at the Digital Chamber’s DC Blockchain Summit earlier this year.
The 32 House incumbents on Fairshake’s latest list are well targeted for the industry’s next legislative maneuvers, with many of them on the House Ways and Means Committee that will deal with crypto tax issues, and many others on the key House Financial Services Committee. Agriculture, science and judiciary panels — each promising to be important for future crypto bills — also are represented by the candidates.
Vetter said his organization has so far backed 53 winners out of 57 races in the primaries and is working toward “the largest pro-crypto caucus in American history.” In many of those primaries, Fairshake favored a candidate from the party that’s likely to win the general election — a strategy it succeeded with in the prior election.
The program also discussed Bitcoin’s price behavior in recent weeks. While a rise in the dollar index normally puts pressure on risky assets, it was noted that despite the US dollar reaching an 18-month high, Bitcoin has maintained its upward trend over the past five or six weeks. The fact that Bitcoin remained above its 50-week moving average while gold fell below it reinforced the view that the cryptocurrency has recently been behaving differently than a classic risk asset.
Related NewsA Critical Day Has Arrived for This Altcoin: $337 Million in Tokens Will Be Unlocked—But There’s an Important Detail
Howell also believes that a rally in the bond market could be a significant catalyst for Bitcoin. Noting that US Treasury bonds are one of the fundamental collaterals in the global financial system, the strategist stated that if bond prices rise and bond volatility decreases, the collateral multiplier will strengthen, injecting more liquidity into the financial system. According to Howell, in such a scenario, Bitcoin could also be expected to rise.
Dave Weisberger similarly stated that Bitcoin reacts to perceived monetary expansion and liquidity inflows with an extremely high beta. Weisberger argued that a strong bond rally could emerge if economic growth slows, bringing with it expectations of further monetary expansion. He said it would be difficult for him to expect Bitcoin not to benefit from such a global bond rally.
Mike McGlone, however, painted a more cautious picture. Arguing that risky assets, including Bitcoin and gold, are still significantly tied to the US stock market, McGlone stated that taking positions against the Fed at current levels carries serious risk. Suggesting that Bitcoin has shown similar performance with much higher volatility in the long term compared to the Nasdaq, McGlone believes that the true resilience of cryptocurrency will only be tested if a significant correction occurs in the S&P 500.
Cardano clears $0.26 as daily money flow stays positive
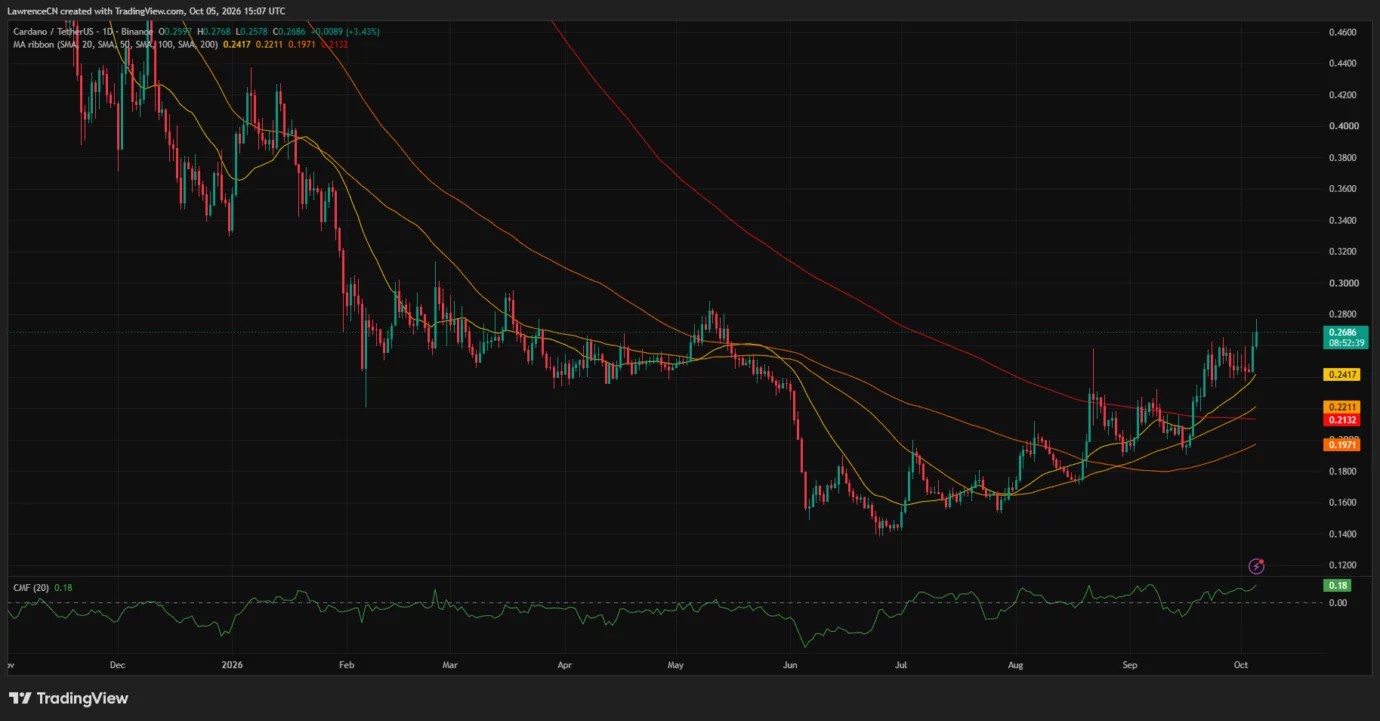
TradingView’s daily chart showed $ADA trading above its 20-day simple moving average at $0.2417, its 50-day average at $0.2211, its 100-day average at $0.1971 and its 200-day average at $0.2132.
The 20-day average was above the other three readings, while the 50-day average also stood above the 200-day average. The 100-day average remained below the 200-day line, leaving the longer-term averages in a different order from the shorter-term pair.
At $0.2686, $ADA traded about 11% above its 20-day average and 26% above its 200-day average. The daily price structure showed a sharp September advance followed by trading around $0.24–$0.26 before the latest push higher.
The same chart recorded Chaikin Money Flow at 0.18. A reading above zero indicates positive buying pressure under the indicator’s volume-based calculation, adding a positive money-flow signal to the move above the recent range.
The daily chart’s next visible historical price area sits around $0.28–$0.29, where $ADA traded during earlier rallies in February, March, and May. The latest high of $0.2768 remained below that area.
Below the breakout, the daily chart placed the nearest tracked moving average at $0.2417. The 50-day and 200-day averages formed a lower reference area around $0.213–$0.221, with the 100-day average farther below at $0.1971.
Analysts put $0.27 and $0.2887 at the center of the setup
Analyst Alex Marzell described $ADA’s breakout from a range between $0.242 and $0.247. He said one hourly candle had gained 6% on roughly 20 times the range’s normal volume.
In his Oct. 5 post, Marzell identified $0.275 as resistance after three rejections and made $0.27 the dividing line for his short-term outlook.
“As long as $0.27 holds I think $0.275 gets taken out and $0.28 opens up.”
The analyst put $0.264 as the retest level if $ADA lost $0.27. TradingView’s later 4-hour reading of $0.2688 placed the token below his stated threshold after its move to $0.2768.
Crypto Patel focused on the two-week chart and identified $0.2887 as his bullish confirmation level. His Oct. 5 post said $ADA was about 98% above his accumulation zone.
$ADA COULD BE ENTERING ITS NEXT MACRO EXPANSION!#$ADA is showing a major long-term accumulation and breakout structure on the 2W chart.
$ADA/$USDT is now ~98% UP from our accumulation zone, yet my macro thesis remains unchanged.
Patel’s longer-term scenario required a sustained higher-timeframe close above $0.2887. He listed targets of $0.50, $1, $2, $3 and $5, making those projections conditional on confirmation above his trigger.
His threshold was about 7.4% above the $0.2688 TradingView reading. Marzell’s nearer $0.28 target was about 4.2% above the same price, placing the two analysts’ confirmation levels on different timeframes.
Liquidation bands gather below $0.27
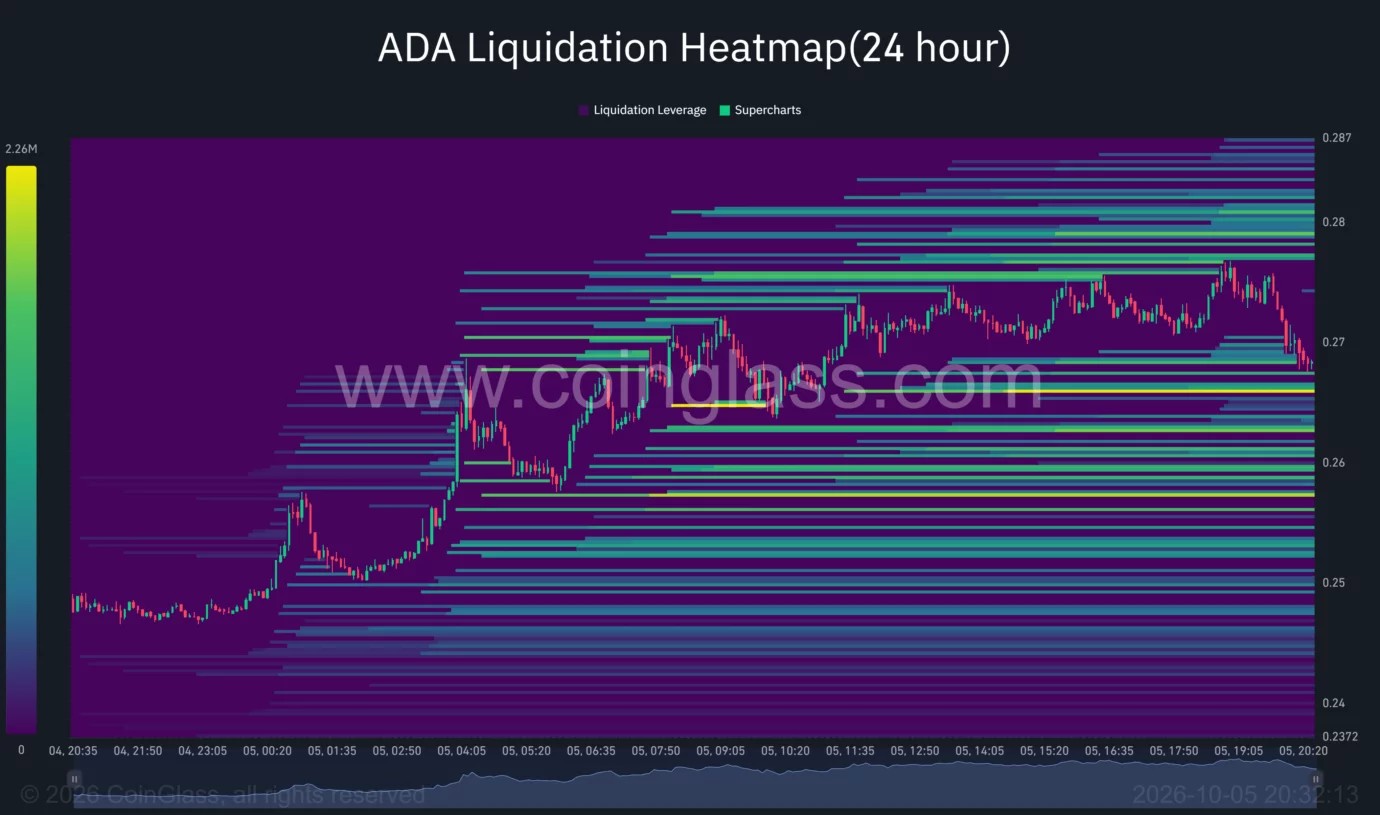
CoinGlass’s 24-hour $ADA liquidation heatmap showed price rising from approximately $0.247 to above $0.275 before pulling back toward $0.268.
Cardano liquidation heatmap | Source: CoinGlass
A bright liquidation band sat near $0.266, immediately below the latest price. Another strong band appeared around $0.257, with additional concentrations around $0.259–$0.263.
Above price, the heatmap showed bands around $0.275–$0.277 and $0.279–$0.281. The upper cluster overlapped with the $0.28 level in Marzell’s outlook.
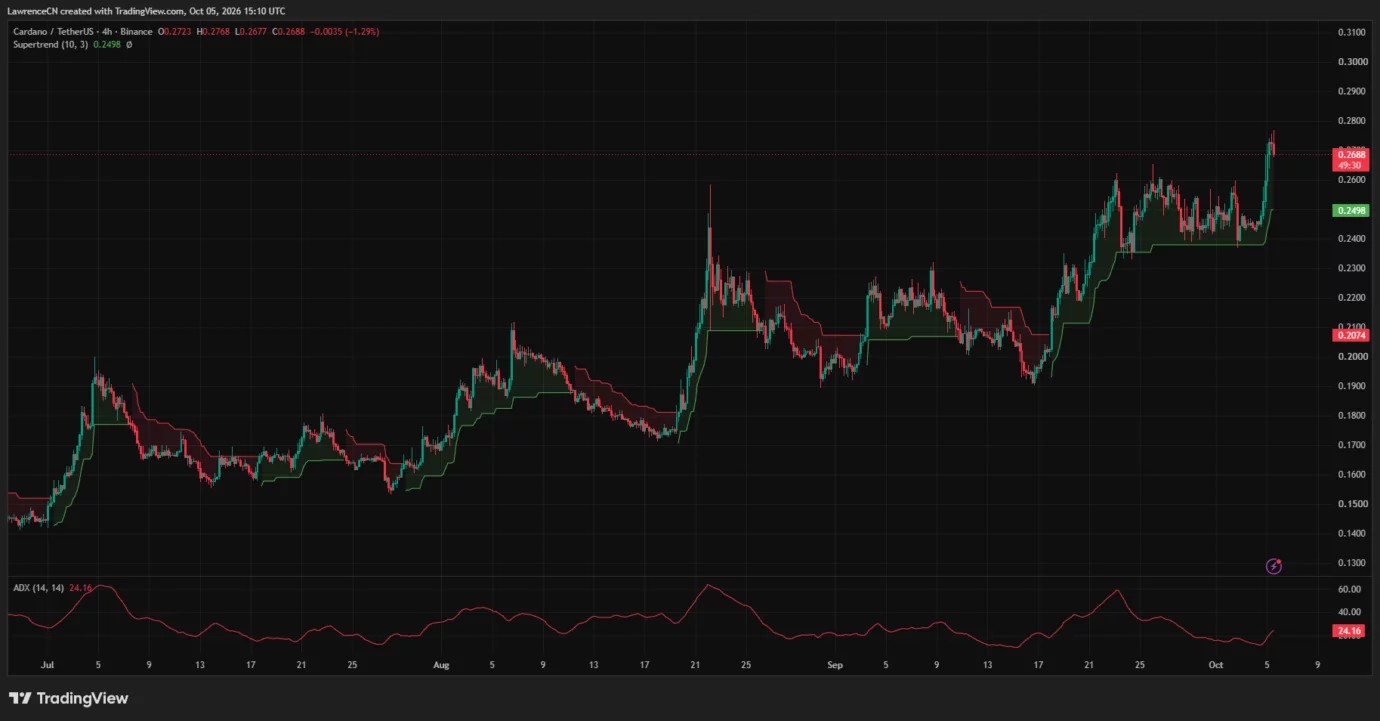
TradingView’s 4-hour Supertrend remained green at $0.2498, below $ADA’s market price. The same chart recorded the Average Directional Index at 24.16, rising from its recent lows toward the commonly watched 25 level for trend strength.
The latest 4-hour price bar showed a retreat of 1.29%, even as price remained above the Supertrend line. The bullish indicator setting therefore accompanied a pullback from the session high.
U.S. funds already include $ADA in their investment universe
Hashdex’s current NCIQ product page listed Cardano at a 0.6% portfolio composition weight as of Oct. 5. The Nasdaq-listed product provides market-cap-weighted exposure to a basket of crypto assets.
Hashdex announced $ADA’s inclusion effective Oct. 1, 2025, alongside Bitcoin, Ethereum, Solana, Stellar and XRP, with holdings subject to quarterly rebalancing.
T. Rowe Price’s Active Crypto ETF also listed $ADA among its eligible assets in a July 14, 2026 filing. The document identified the fund’s ticker as TKNZ and its exchange as NYSE Arca.
For the immediate price setup, Marzell’s $0.27 threshold sits above $ADA’s latest chart reading, while his $0.264 retest level falls below it. Patel’s broader bullish scenario remains tied to a sustained close above $0.2887.
Sunrise announced $SHIB’s availability on Solana on Oct. 4, with the official Shiba Inu and Solana accounts also confirming the launch, according to Solana Compass. The analytics platform reported that the token became tradable through services including Raydium, Jupiter, and Phantom.
Solana Compass recorded 3,005 trades worth approximately $300,000 across 1,401 wallets during a five-minute window shortly after the announcement. Its early figures also showed about $514,000 in pool liquidity.
The launch gives $SHIB another venue for trading as its daily chart tests resistance. Nevertheless, the price recovery visible on TradingView began before the Oct. 4 announcement, with the token already climbing from its summer base through August and September.
For U.S. holders following the October setup, the technical reference here is Binance’s $SHIB/$USDT market. Its quoted levels reflect that trading pair, while execution prices on other exchanges or Solana trading venues may differ.
Shiba Inu holds above four daily moving averages
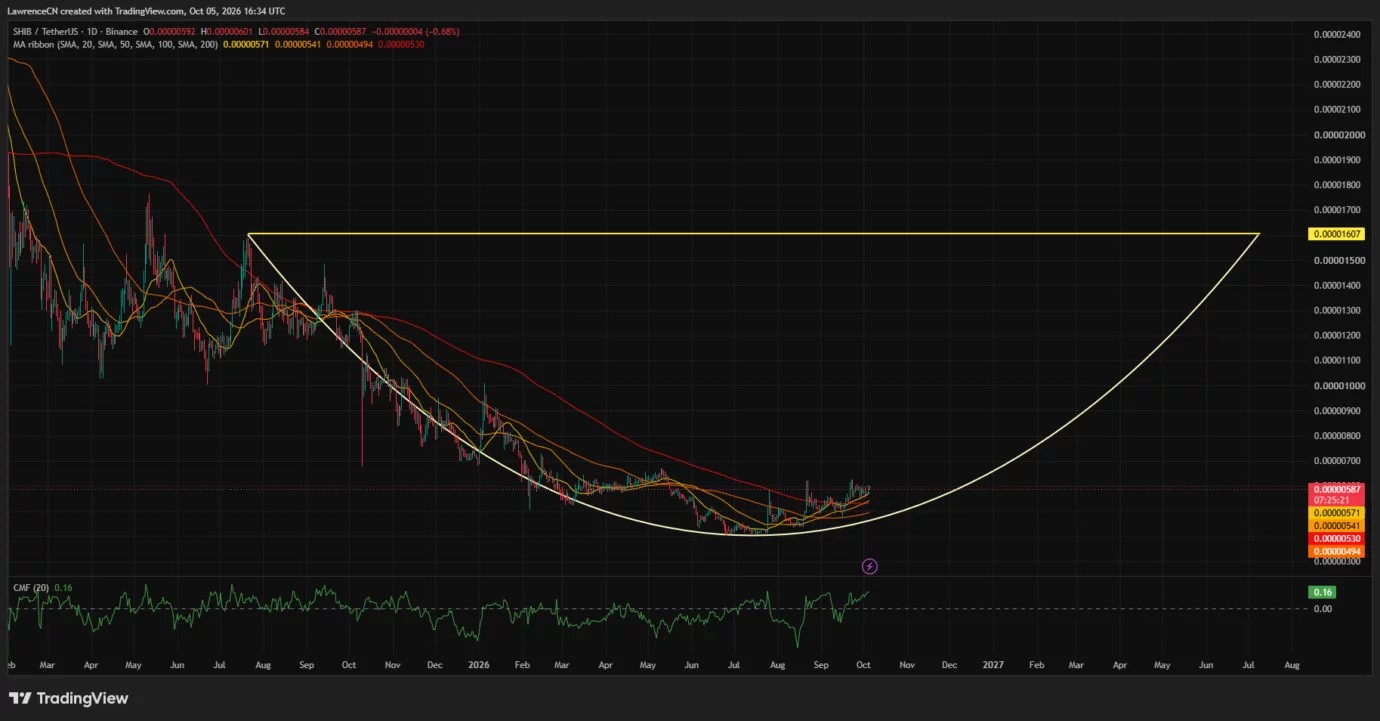
The daily TradingView chart shows the 20-day simple moving average at $0.00000571 and the 50-day average at $0.00000541. The 100-day average stands at $0.00000494, while the 200-day average sits at $0.00000530.
At $0.00000587, $SHIB trades approximately 2.8% above its 20-day average. The relatively small gap makes $0.00000571 the first moving-average level to watch if the token retreats from resistance.
Below that level, the 50-day and 200-day averages form a second reference zone between $0.00000530 and $0.00000541. A pullback into that area would surrender more of the recent advance and place price back among its longer-term trend measures.
The averages have not yet formed a fully bullish sequence. Although the 20-day average sits above the other three, the 100-day average remains below the 200-day average, reflecting the earlier decline.
Daily Chaikin Money Flow reads 0.16. Its positive reading supports the improving daily setup, although a sustained advance would still require price to clear the nearby highs.
The daily chart also contains a broad curved annotation running from the July 2025 peak, through the 2026 base, toward a horizontal level at $0.00001607. That level is roughly 174% above the latest price and belongs to a much larger potential recovery structure.
For October, the nearer $0.00000600–$0.00000630 area takes priority. $SHIB would need to overcome those levels before the distant upper boundary becomes relevant to the immediate outlook.
Weekly resistance at $0.00000596 remains the first hurdle
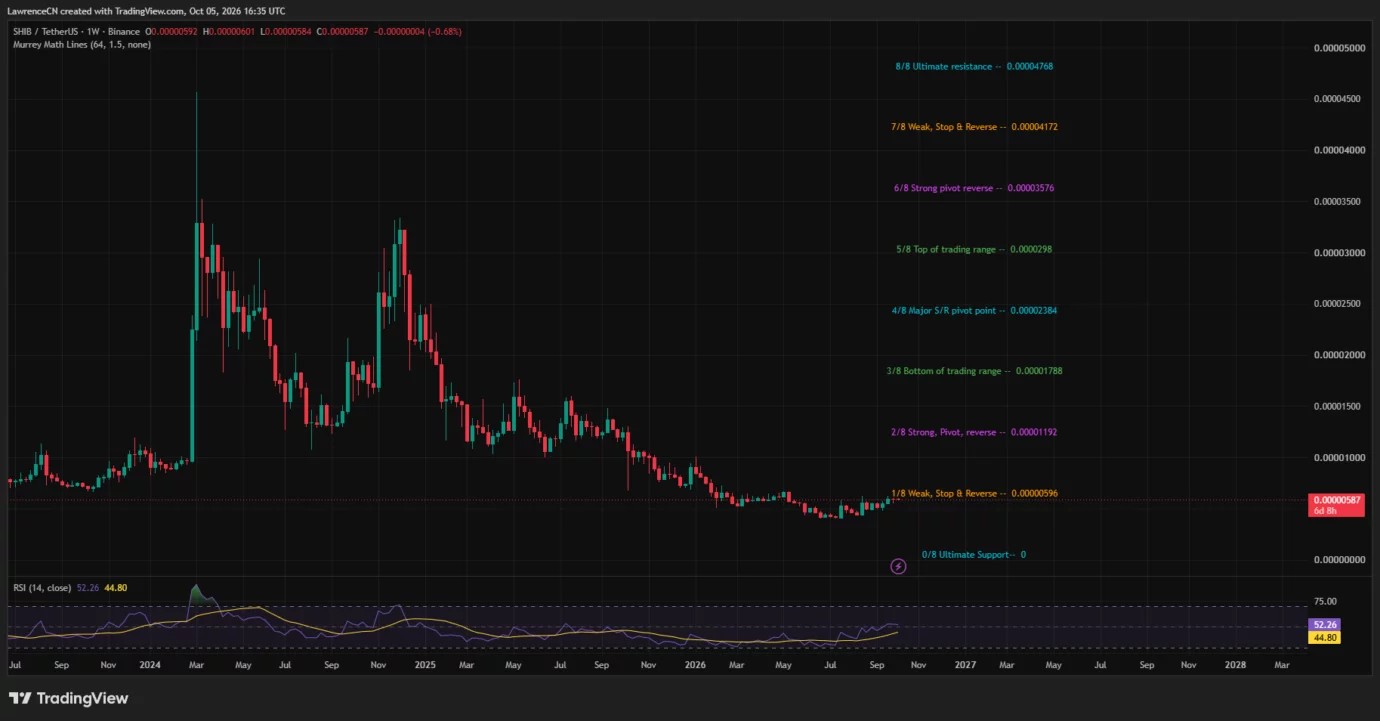
The weekly TradingView chart places $SHIB just below a Murrey Math resistance level at $0.00000596. The latest price is approximately 1.5% beneath that threshold, which closely overlaps the daily resistance area around $0.00000600.
Weekly RSI stands at 52.26, above the neutral 50 line and its displayed average of 44.80. The reading marks firmer momentum than during the earlier decline, while remaining below the conventional overbought threshold of 70.
Price and momentum therefore present slightly different stages of recovery: RSI has moved above its midpoint, while $SHIB continues to test its first nearby weekly resistance.
A sustained move above $0.00000596–$0.00000600 would strengthen the near-term bullish case. Repeated rejection there would leave the token trading close to the same ceiling despite its improving indicators.
On X, market commentator Terrarmy described a potential daily ascending triangle and rising support on the 4-hour timeframe. The account also pointed to a possible test of longer-term descending resistance.
🔥🐕 $SHIB THE BIGGEST BREAKOUT COULD BE AHEAD! 🚀
Something interesting is forming on the $SHIB charts.
4H Chart: An ascending support trendline is forming, with price approaching a key resistance zone.
1D Chart: A potential ascending triangle structure is developing. A… pic.twitter.com/DfXv93hf11
— Terrarmy 🐋 (@terra_army) October 4, 2026
Terrarmy tied the bullish scenario to breakouts backed by strong volume and acknowledged the possibility of failed breakouts or support losses. The October outlook therefore remains conditional on $SHIB clearing resistance while preserving its recent higher lows.
October targets cluster around $0.00000610–$0.00000630
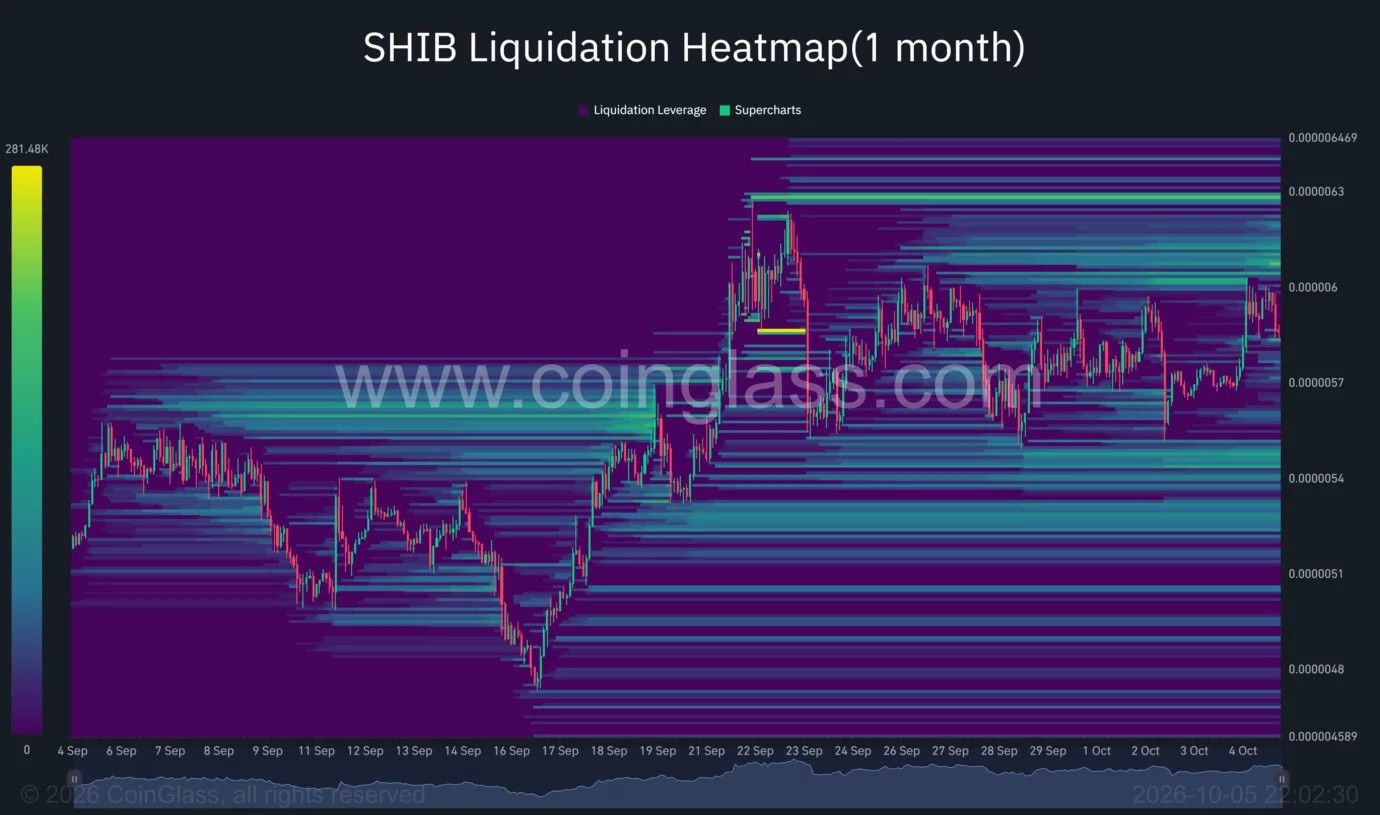
CoinGlass’s one-month liquidation heatmap shows overhead concentrations around $0.00000610 and $0.00000630. Both sit above the immediate $0.00000596–$0.00000600 resistance zone.
Shiba Inu liquidation heatmap | Source: CoinGlass
If $SHIB clears that first barrier and holds above it, $0.00000610 becomes the next nearby upside reference. The higher $0.00000630 area also lies close to the September peak visible on the heatmap.
From $0.00000587, moves to $0.00000610 and $0.00000630 would represent gains of approximately 3.9% and 7.3%, respectively. Reaching the upper zone would require $SHIB to push beyond several recent highs.
Below current prices, the heatmap shows liquidation concentrations around $0.00000545–$0.00000550 and another band near $0.00000530. Those areas broadly overlap the support region identified by the daily moving averages.
The short-term bullish scenario holds while $SHIB preserves its daily support and breaks through $0.00000600. A loss of $0.00000571 would put the lower $0.00000545–$0.00000550 area in focus, followed by $0.00000530–$0.00000541.
October’s immediate test is whether $SHIB can turn the $0.00000596–$0.00000600 ceiling into support. Until that happens, the charts show an improving recovery, with resistance still close overhead.
Solana-focused ETFs recorded $2.43 million in net inflows last week, according to CoinGlass data.
That compares with $188.22 million the previous week—a decline of approximately 98.7%. Although the funds extended their positive streak to 14 consecutive weeks, the latest total shows a substantial reduction in fresh allocations.
The distinction is important: demand slowed sharply, but the funds did not experience a net weekly withdrawal.
The figures suggest ETF buying offered much less support than during the preceding week. Whether that represents a temporary pause or a more persistent slowdown will depend on subsequent flows.
ETF activity also captures only one channel of $SOL investment. It does not provide a complete measure of buying and selling across exchanges, decentralized markets, and other investment vehicles.
Solana’s network continued showing signs of active usage despite softer ETF inflows.
According to SolanaFloor, the network’s decentralized exchange volume on Sunday exceeded the combined volume of Ethereum mainnet, Ethereum Layer-2 networks and Hyperliquid.
🚨JUST IN: @Solana recorded more spot DEX trading volume yesterday than Ethereum mainnet, all Ethereum L2s and Hyperliquid combined. pic.twitter.com/nJPYTt49Fq
The comparison highlights strong activity during that session, although one day’s performance does not establish a lasting lead.
The platform also cites more than $4.4 billion in tokenized-stock trading volume on Solana. That points to growing activity around blockchain-based exposure to traditional equities.
The supplied figures do not specify the measurement period for that total. It should therefore be distinguished from the Sunday DEX comparison rather than treated as a daily reading.
Together, the reports support a picture of continued ecosystem participation, even as investment through ETFs moderates.
Solana technical forecast: Triangle pattern keeps breakout levels in focus
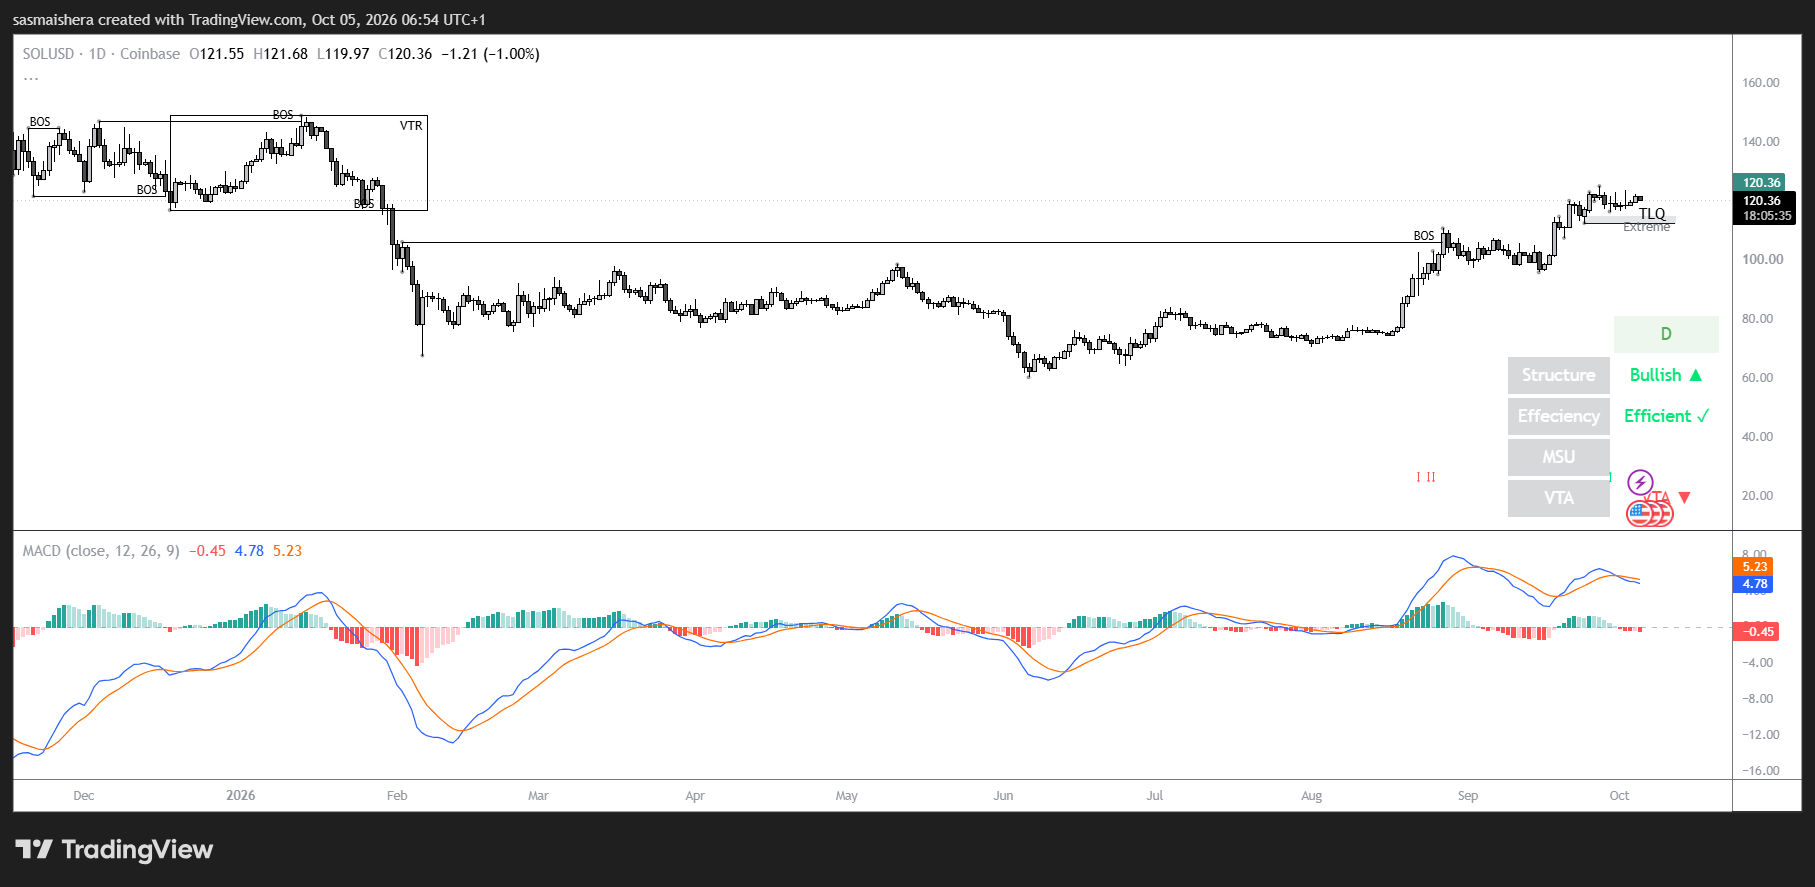
On the four-hour and daily charts, $SOL remains above its 50-, 100-, and 200-period exponential moving averages, positioned around $119.24, $116.43, and $110.44.
A rising support trendline near $119.16 and overhead resistance around $123 form the triangle. This narrowing structure suggests price is consolidating between nearby buying and selling levels.
The pattern alone does not determine which direction the eventual breakout will take.
Daily momentum remains constructive. The Relative Strength Index is near 54, while the Moving Average Convergence Divergence indicator is mildly positive.
Those readings favor a modest bullish bias rather than an especially strong momentum surge.
The immediate upside hurdle is the resistance trendline around $123, followed by September’s high at $124.95.
A confirmed move above both levels would strengthen the case for extending the recovery. The Fibonacci projection places the next potential target at $132.87.
That target remains conditional on a successful breakout. A brief move above resistance followed by a reversal would provide weaker confirmation than sustained trading above the cluster.
Initial support is concentrated between approximately $118.71 and $119.25.
That area combines a Fibonacci level, the rising trendline, and the 50-period EMA. Holding it would help preserve the short-term recovery structure.
A decisive break below the cluster would bring the 100-period EMA near $116.43 into focus. The 200-period EMA around $110.44 sits further below.
For now, $SOL’s technical bias remains mildly bullish, but its next move depends on whether buyers defend nearby support and generate enough demand to overcome resistance.
Hoskinson rejected that argument, noting that $NIGHT itself was issued on Cardano and asking why a project built from the Cardano ecosystem should be viewed as harmful to it.
The stupidity is strong here. Apparently, launching a project on Cardano is bad for Cardano. Tell me where is night the issued. What was the first CNA to be listed on Binance? What wallets do people use to manage their night?
If this is how Cardano treats the people building on… https://t.co/j2x0TvJl63
— Charles Hoskinson (@IOHK_Charles) October 3, 2026
Another critic went further, comparing Hoskinson to a “used car salesman” and pointing to what he described as weak liquidity, stablecoins, and DEX volume.
He also accused Hoskinson of blaming $ADA holders rather than developers when the ecosystem struggles.
Charles starting to sound like a used car salesman. If the cars broken, it’s your problem. Low liquidity, no stablecoins, no DEX volume. $ADA holders are aways the issue with him never the DEVs. We’ve been taken for a ride full circle. Most people just want their money back.
— Kash_the_Kreator (@Nikkash4) October 4, 2026
Hoskinson Points to RealFi, Midnight and New Integrations
Hoskinson responded with a list of projects that have moved forward this year.
Explain what I should do differently. We just launched RealFI; Pogun is on the way; we launched Midnight; and now we have Midnight. city. We did the Pentad that brought LayerZero, Fireblock, Pyth, Circle, and other integrations to Cardano. We have Draper and Alphagrowth. All…
— Charles Hoskinson (@IOHK_Charles) October 4, 2026
RealFi went live on Cardano mainnet on Oct. 1, following months of public testing. Midnight, meanwhile, launched its network in March, while $NIGHT had already launched as a Cardano Native Asset in December 2025.
Midnight.city is also operating in open beta as an AI-focused application tied to the wider Midnight ecosystem.
He also mentioned Pogun, a Bitcoin-focused DeFi project covering credit, yield and bridging. Its 12.29 million $ADA treasury request failed to secure enough support in September, although Hoskinson has continued to say the project is moving ahead.
Then there is the Pentad’s infrastructure push. USDCx and Pyth have gone live, LayerZero is being rolled out in phases, and Fireblocks announced plans to add full support for Cardano Native Tokens.
Cardano Now Has to Turn Development Into Usage
This is where the criticism becomes measurable.
Cardano currently has about $68.3 million in DeFi TVL and $67.2 million in stablecoins, so the claim that it has “no stablecoins” or DEX activity is not literally accurate. DEXs processed about $4.05 million over 24 hours and $41 million over seven days, with weekly volume up 133%. The network also recorded roughly 18,964 active addresses and 34,905 transactions over 24 hours.
Those numbers show activity, but they also provide the benchmark against which Hoskinson’s recent launches can now be judged.
The Crypto Basic previously reported that Hoskinson believes RealFi could become a major driver of Cardano TVL and eventually help push it toward $1 billion. With RealFi only reaching mainnet this week, that thesis has now moved from development promises to something that can be measured against actual deposits and usage.