Category: Business

  • Solana DeFi Tests Liquidity Depth as USDC Borrow Rates Surge

    Solana DeFi Tests Liquidity Depth as USDC Borrow Rates Surge

    • The Solana ecosystem suffers a liquidity crisis after the security breach at KelpDAO on April 20, draining $USDC reserves.
    • Leading protocols such as Jupiter and Kamino report utilization levels near 100%, limiting access to capital for new loans.
    • Stablecoin lending yields have climbed to 10.2%, marking record levels in the network’s credit infrastructure.

    Following the KelpDAO security incident that shook investor confidence, the DeFi sector on Solana is undergoing a systemic challenge. The massive outflow of capital has created a bottleneck in stablecoin availability, driving up operating costs.

    DeFi Funds Outflow Spreads to Solana

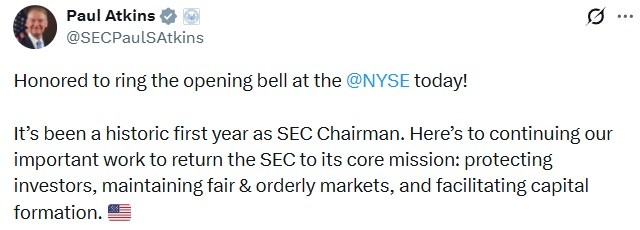
    Following the KelpDAO rsETH hack, the chain reaction has further spread from EVM networks to Solana. Several $USDC markets on Solana’s leading lending protocol Kamino have seen sharp surges in deposit APY and utilization rates. The Prime… pic.twitter.com/mbAaEi31R4

    — Wu Blockchain (@WuBlockchain) April 20, 2026

    Technical data shows the magnitude of the crisis: Jupiter Lend, with $421 million in deposits, maintains a 99% utilization rate. Meanwhile, the Kamino market records an interest rate of 10.2% on $USDC, with barely any remaining liquidity to withdraw or borrow.

    The pressure on the ecosystem is not superficial, as the main credit markets are operating at the limit of their technical capacity. This situation forces users to re-evaluate their positions in the face of the scarcity of liquid assets.

    As liquidity providers withdraw their funds for fear of contagion, interest rates act as a defense mechanism. However, this rising cost of credit is paralyzing leverage strategies that are vital to the network.

    Smaller protocols are also feeling the impact, with platforms like Marginfi reporting utilization levels exceeding 88%. The interconnection of Solana’s DeFi markets amplifies every capital outflow movement at an accelerated pace.

    The impact on borrowing costs and prediction markets

    The sudden spike in $USDC rates has shifted the cost landscape for end users. Specific vaults on Kamino, such as Staekhouse, now show interest rates consistently exceeding 8% APR.

    This environment of “digital dollar scarcity” has indirectly affected the price perception of the native token SOL. Prediction markets have reacted with pessimism, assigning minimal probabilities to an immediate recovery of the asset above certain thresholds.

    It is evident that market sentiment has turned toward extreme caution, reflected in low derivatives trading volume. The lack of circulating $USDC prevents strong buying positions from forming, limiting any attempt at a technical rebound.

    Even veteran platforms like Save Finance have crossed 70% utilization, indicating that the problem is structural and not limited to a single protocol. Market depth is being tested like never before in this financial cycle.

    User trust is now the scarcest resource, beyond the technical liquidity in smart contracts themselves. The coming days will be crucial to determine if the network can attract new capital to stabilize interest rates.

    Despite Solana’s technological robustness, its dependence on external liquidity is exposed during external security events. The normalization of rates will depend entirely on the speed at which deposits return to money markets.

    The Solana network is going through a critical period of liquidity stress caused by the KelpDAO incident. With utilization rates at the limit and borrowing costs on the rise, the DeFi ecosystem requires an urgent injection of capital to restore operability and user confidence.

  • Bank for International Payments (BIS) Warns Again! “These Cryptocurrencies Are Risky, Cooperation is Necessary!”

    Bank for International Payments (BIS) Warns Again! “These Cryptocurrencies Are Risky, Cooperation is Necessary!”

    The Bank for International Payments (BIS), which is skeptical of Bitcoin (BTC) and cryptocurrencies, shares no different view regarding stablecoins.

    According to Reuters, BIS Managing Director Pablo Hernandez de Cos expressed his concerns about stablecoins while speaking at a Bank of Japan (BOJ) seminar in Japan.

    BIS Director General Cos stated that dollar-denominated stablecoins like Tether ($USDT) and $USDC are by nature more similar to exchange-traded funds (ETFs) than to cash. Cos warned that stablecoins are closer to investment products than cash and could pose a significant threat to financial stability if they continue to grow.

    Cos specifically stated that the current structure of dollar-indexed stablecoins, such as $USDT and $USDC, is not suitable for use as a payment method and does not meet the necessary requirements.

    The BIS director general also added that because stablecoin issuers’ reserves consist of short-term government bonds and bank deposits, market instability could lead to large capital outflows and subsequent chain reactions.

    “Because the reserve assets held by stablecoin issuers consist of short-term government bonds or bank deposits, in stressful situations, if large-scale repayment demands arise, they may be forced to urgently sell these assets or put pressure on banks’ financing conditions.”

    Finally, Cos emphasized the need for global cooperation on regulation, adding that if dollar-indexed stablecoins grow large enough to compete with fiat currencies, it could have a negative impact on both financial stability and global economic policy.

    *This is not investment advice.

  • Ethereum Price Prediction: Bullish Shift, Key Test Ahead

    Ethereum is showing two signs of strength at the same time. One chart shows the first bullish SuperTrend flip in more than a year, while another shows $ETH still holding a long term support curve that keeps the $8,000 cycle target in play.

    Ethereum SuperTrend Turns Bullish After More Than a Year

    Ali Charts says Ethereum’s SuperTrend indicator has flipped bullish for the first time in over a year. The chart shows that shift clearly. $ETH is trading near $2,312, while the new buy signal appears around the $1,675 area after a long period of bearish trevnd signals.

    Ethereum Daily Chart. Source: TradingView / Ali Charts on X

    This matters because the SuperTrend indicator is designed to track broader trend direction, not small short term moves. On this chart, the last bullish phase led into Ethereum’s rise toward the $4,000 to $5,000 range. Then the indicator turned bearish near the top and stayed negative through the long decline and choppy recovery.

    Now the signal has changed again. That does not guarantee a major breakout, but it does show that Ethereum has moved back above a level that had capped the trend for months. As long as $ETH holds above the flipped support zone, the chart supports a stronger medium term recovery case rather than another brief relief rally.

    Ethereum Long Term Trendline Keeps $8,000 Target in View

    James argues that Ethereum can still reach $8,000, and the chart shows why that view remains active. On the weekly chart, $ETH is sitting near a rising long term trendline that has supported the market through several major cycles since 2016.

    Ethereum / U.S. Dollar Weekly Chart. Source: TradingView / James on X

    That trendline is the key feature here. Ethereum has returned to it after failing to hold the higher range above $3,000. Even so, the chart does not show a full structural breakdown yet. Instead, it shows price testing a support curve that has remained intact across multiple years.

    The $8,000 level on the chart is a long term upside marker, not a near term target. For that scenario to stay credible, Ethereum needs to keep defending the current trend support and then rebuild momentum from this area. If that happens, the broader cycle structure would still allow another leg higher. If support breaks decisively, the long term bullish case would weaken.

  • LI.FI Earn Integrates with Soneium to Simplify Cross-Chain Yield Access

    LI.FI Earn Integrates with Soneium to Simplify Cross-Chain Yield Access

    A new integration between LI.FI and Soneium have been announced to streamline access to decentralized finance (DeFi) yield opportunities for developers and teams. The partnership brings in LI.FI Earn as an infrastructure layer in the Soneium ecosystem, which provides a single platform to internally integrate yield onchain across many protocols and blockchains.

    Something Soneium builders may find useful 👇@lifiprotocol Earn is a new infrastructure layer aimed at teams looking to integrate onchain yield capabilities. Rather than managing multiple vault integrations independently, teams may find value in a unified approach spanning 20+… pic.twitter.com/AAlnVIj4x7

    — Soneium 💿 (@soneium) April 20, 2026

    The shift is part of a wider trend in the industry to become more abstract with complex operations behind the scenes being simplified into single entry points to developers. Unlike having teams combine many extent vault protocols separately, LI.FI Earn provides access through a single interface and has minimal technical overhead.

    Unified Access Across Chains and Protocols

    LI.FI Earn is created to handle an assortment of 20 or more vault protocols and 60 or more blockchain networks, as well as one of the broader ecosystems of yield aggregation solutions available today. With the Soneium adoption, developers now have access to a plethora of yield opportunities without having to construct dedicated integrations per protocol.

    Such a single-market strategy is especially timely in a disaggregated DeFi, where liquidity and yield platforms are fragmented across a wide variety of ecosystems. With LI.FI Earn, teams based on Soneium can provide users with a convenient entry point to these opportunities via a single entry point, enhancing their efficiency and experience.

    Meanwhile, flexibility is also one of the basic elements of the system. Selection of protocol and user eligibility have full configuration, so that integrating teams can customize yield offerings to their application needs or compliance requirements.

    Built-In Optimization Features for Developers

    Beyond aggregation, LI.FI Earn also provides a variety of in-built capabilities which are designed to enhance the efficiency of transactions and minimize risk. These are gas estimation systems, slip protection systems, and automated structuring of transactions.

    These attributes are essential in DeFi experience, where changing costs and asset prices can have important consequences on users. The implementation of these safeguards at the infrastructure layer, LI.FI Earn reduces the end user development work and increases end-user reliability.

    This strategy is in line with the overall objective of Soneium to make blockchain development more approachable. Supported by Sony via Sony Block Solutions Labs Soneium is dedicated to empowering creators and developers to develop scalable, user friendly decentralized applications.

    Seamless Cross-Chain Deposit Flows

    A notable feature of the integration is how it can manage cross-chain deposit flows. Conventionally, users have to do several operations manually: swapping tokens, transferring assets between chains, and ultimately depositing the assets in yield protocols. The steps add friction and risk.

    LI.FI Earn is an attempt to summarize all this in one flow that is handled at the infrastructure level. The system has automated the chain swap → bridge → deposit sequencing so that users are able to transfer the assets across chains and into yielding strategies with little effort.

    This will not only increase user experience but also minimize chances of mistakes when making multi-step transactions. To developers, it does not require them to create intricate workflows but lets them concentrate on the essential features of the product instead.

    Implications for the Soneium Ecosystem

    The integration of LI.FI Earn makes Soneium a more developer-friendly blockchain solution. It reduces the cost of integrating DeFi, allowing more applications to gain access to yield generating features, including wallets, financial services providers and more.

    With the increasing rivalry of blockchain ecosystems, improvements of this kind at the infrastructure level may be decisive in enticing developers. Easier access to cross-chain liquidity and yield strategies are also a major distinction that is becoming more prominent.

  • Top 2 Memecoins Surging Right Now After ASTEROID’s Historic 68,000% Weekly Rally

    Top 2 Memecoins Surging Right Now After ASTEROID’s Historic 68,000% Weekly Rally

    $ASTEROID’s extraordinary run changed the conversation. A token that sat at a $50,000 market cap before Elon Musk replied to a girl’s SpaceX mascot request briefly touched a $20 million market cap within hours and posted a 68,428% weekly gain according to CoinGecko data before pulling back roughly 40%.

    The question traders are now asking is if $ASTEROID can do that, what moves next? Two tokens are being mentioned with increasing frequency in memecoin communities: Amaterasu Omikami (OMIKAMI) and RyuJin (RYU).

    The Case for OMIKAMI and RyuJin

    One expert who has covered OMIKAMI over three years pointed to the $ASTEROID move as evidence that the memecoin supercycle has further to run. His conviction is rooted in the longevity of both projects rather than short-term momentum.

    Both tokens have been active for nearly two years with what the analyst describes as organic community growth rather than manufactured hype. The ecosystem is allegedly connected to Ryoshi, the pseudonymous figure behind Shiba Inu, though that attribution remains unverified and disputed within parts of the community.

    OMIKAMI currently trades at approximately $0.007112 with a market cap of $6.73 million. RyuJin sits at $0.000000002961 with a $2.85 million market cap. Both the tokens are up by more than 13%.

    The $ASTEROID Parallel

    The analyst drew a direct comparison between OMIKAMI’s current position and where $ASTEROID sat before its viral moment. Both had a story. Both had a community. $ASTEROID had a single external catalyst that lit the fuse.

    The structural difference is the nature of that catalyst. $ASTEROID moved because of a verifiable two-word reply from one of the world’s most followed public figures. OMIKAMI’s anticipated catalyst is expected to come from within the ecosystem itself, potentially a new communication from Ryoshi or a product announcement tied to a planned blockchain and debit card infrastructure the project has been developing.

    The Broader Macro Setup

    The analyst also said that the broader market context is constructive for memecoin activity. Bitcoin is retesting a breakout level on the four-hour chart and Ethereum is approaching key resistance. Both are approaching moves that have historically preceded altcoin and memecoin cycles.

    The CLARITY Act, a potential new Fed chair and stablecoin yield legislation are all cited as macro catalysts that could inject significant fresh liquidity into crypto broadly.

  • Will XRP price break out of the symmetrical triangle or slide as the 4H MACD turns bearish at the apex?

    $XRP price is at $1.4311 on April 20, as the 4H chart shows a symmetrical triangle reaching its apex simultaneously with a bearish MACD crossover, compressing an imminent directional resolution into the tightest point of the pattern.

    $XRP ($XRP) price is at $1.4311 on April 20, down 0.13% on the 4H session, as a symmetrical triangle on the 4H chart compresses price between a descending upper trendline from the February highs above $1.90 and an ascending lower trendline from the March lows around $1.20. The pattern has reached its apex, and a directional resolution is now imminent. The 4H MACD has simultaneously printed a bearish crossover, with the histogram at -0.0032, adding a momentum signal that aligns with the descending upper trendline acting as resistance overhead. The MA ribbon is partially bullish: SMA 50 at $1.4018, SMA 100 at $1.3689, and SMA 200 at $1.3729 all sit below current price, but the SMA 20 at $1.4373 remains just above price and is acting as the first resistance on a 4H closing basis.

    The 4H symmetrical triangle has been forming since the February peak at approximately $1.90, with the upper descending trendline connecting successive lower highs and the lower ascending trendline connecting successive higher lows from the March cycle lows. Volume has been declining throughout the compression phase, which is consistent with the typical symmetrical triangle structure and suggests an expansion of volatility is approaching as the apex closes.

    The 4H symmetrical triangle defines the current $XRP price structure across the period from December 2025 through April 2026, with the converging trendlines now meeting at the current price level. The 4H MACD (12,26,9) has produced a bearish crossover inside the triangle at the apex, with the MACD line at 0.0021 crossing below the signal at 0.0052 and the histogram at -0.0032. Both lines remain above zero, which limits the severity of the bearish signal relative to a subzero crossover, but the directional shift at the triangle apex and SMA 20 resistance overhead is the most relevant nearterm momentum reading.

    The SMA 20 at $1.4373 is the key technical level sitting just above price. Until $XRP closes a 4H candle above it alongside the upper triangle trendline, the bearish crossover is the operative 4H signal. A prior analysis published April 15 on crypto.news identified $1.50 as the primary target for an $XRP symmetrical triangle breakout, with the pattern’s measured move from the widest point of the triangle pointing toward that level. Technical convention states that symmetrical triangles resolve with a move equal to the height of the pattern’s widest part from the breakout point, and the widest portion of the current triangle measures approximately $0.25, placing the full measured target near $1.68 on an upside resolution from the $1.43 apex.

    Key Levels: Support, Resistance, and Price Targets

    The SMA 20 at $1.4373 is the first resistance above current price. A 4H close above it, alongside a close above the upper descending trendline, confirms the symmetrical triangle breakout and opens $1.50 as the immediate target. A sustained move above $1.50 brings the SMA 100 at $1.5625 into view as the next significant resistance in the extended bull case.

    On the downside, the lower ascending trendline is currently near $1.37 to $1.38 on the 4H chart. A confirmed 4H close below the lower trendline breaks the symmetrical triangle structure and shifts the bias decisively bearish, exposing $1.30 as the next structural support. The lower trendline aligns with the Fibonacci 1.0 retracement level identified in prior daily chart analysis as the key floor below the current pattern. Below $1.30, $1.20 represents the last major demand zone before uncharted territory in the current correction.

    Invalidation of the bull case: a 4H close below $1.37.

    On-Chain and Market Data Context

    $XRP perpetual futures open interest stands at approximately $2.48 billion per Coinglass, down sharply from the over $9 billion recorded in early October 2025. The substantial deleveraging of speculative positioning over the past six months reduces the risk of a cascade liquidation event on either a breakout or a breakdown from the current triangle apex, creating a cleaner technical setup than the crowded positioning of the prior quarter. The 4H volume of 11.04M $XRP on the current session is in line with recent sessions, confirming neither a strong conviction breakout nor a distribution event at the apex.

    $XRP ETF inflows reached $17 million in the week of April 14, the strongest weekly inflow since early February, providing a structural demand tailwind that runs counter to the 4H MACD bearish crossover signal. The divergence between improving institutional demand and deteriorating 4H momentum at the triangle apex is the key tension driving the current directional uncertainty.

    If $XRP closes a 4H candle above the SMA 20 at $1.4373 and the upper triangle trendline with expanding volume, $1.50 is the primary nearterm target with $1.5625 as the extended objective. A 4H close below the lower triangle boundary near $1.37 triggers the bearish resolution of the apex with $1.30 as the immediate downside objective.

  • Follow the Money: The 5 Cryptos Favored by US Congress Members

    Follow the Money: The 5 Cryptos Favored by US Congress Members

    Under the 2012 STOCK (Stop Trading on Congressional Knowledge) Act, congressional members and other government employees are mandated to report stocks, bonds, and cryptocurrency trades of over $1,000 within 45 days of executing them.

    Here is a compilation of the top 5 crypto choices, and a few little-known extra choices:

    Top 5 crypto choices in the US Congress

    The first is Bitcoin ($BTC), the most widely held asset among legislators. Wyoming Senator (Sen.) Cynthia Lummis, a prominent speaker on crypto policy, disclosed her first Bitcoin purchase in 2013. Others who have made $BTC purchases include Sen. Ted Cruz and Representatives (Rep.) Byron Donalds and Guy Reschenthaler, with reports of individual holdings worth up to $250,000.

    Other lawmakers, such as Rep. Sheri Biggs and Sen. Dave McCormick, have Bitcoin exposure through ETFs from Valkyrie, VanEck, and Ether. Meanwhile, a couple of others, such as Sen. Sheldon Whitehouse, have invested in Bitcoin-related companies, including PayPal, BlackRock, and The Block (formerly Square).

    The second is Ethereum ($ETH), held by members of Congress such as Reps. Mike Collins and Barry Moore, with the former holding up to $60,000 in $ETH. Rep. Marjorie Taylor Greene and Sen. Dave McCormick have invested in Ethereum ETFs.

    Third is Solana (SOL) and fourth is XRP, both reported by Rep. Guy Reschenthaler, and each valued at up to $15,000. Fifth is Cardano (ADA), disclosed by Reps. Barry Moore and Mike Collins, with the former holding a portion worth up to $45,000.

    Little-known coins

    While the above constitute the top 12 crypto coins by market cap, policymakers have also made some outlier investments. Rep. Mike Collins purchased the Ski Mask Dog (SKI), while Rep. Madison Cawthorn held and promoted the LGB Coin.

    Other coins in this category include The Graph (GRT), Velodrome (VELO), and Aerodrome Finance (AERO).

    In the past 24 hours, all these cryptocurrencies have gained between 1.8% and 4% following shifts in the geopolitical and macroeconomic environment.

    Source: CoinMarketCap

    SKI, however, stands out, having dropped 2.86%.

    Source: CoinMarketCap

  • Bitcoin Price Reclaims $76,000 as Donald Trump Touts New Iran Deal Terms

    Bitcoin Price Reclaims $76,000 as Donald Trump Touts New Iran Deal Terms

    Bitcoin price moved back above $76,000 on April 20 after a volatile weekend tied to developments in the United States-Iran conflict. The rebound followed a pullback toward $75,000 as traders reacted to renewed pressure in oil markets and fresh uncertainty around diplomacy.

    Market attention also shifted after President Donald Trump said a new U.S. deal with Iran would be better than the 2015 nuclear agreement. That statement arrived as the current ceasefire approached its end and doubts remained over the timing of another round of talks. Against that backdrop, Bitcoin continued to trade as a macro-sensitive risk asset, with price moves shaped by oil, geopolitics, and positioning across derivatives markets.

    Bitcoin Price Steadies After Weekend Pullback

    Bitcoin price held above $76,000 after retreating from a failed move beyond $78,000. The earlier rise marked the asset’s highest level in about ten weeks before momentum faded into the weekend. Traders reduced risk as tensions in the Middle East returned to the forefront and oil markets turned higher again.

    The weekend reversal reflected broader caution across global markets. Reports tied to the Strait of Hormuz and renewed friction between Washington and Tehran pushed crude prices back toward the $90 range. That added pressure to inflation expectations and weighed on assets that are sensitive to macro uncertainty, including Bitcoin.

    Donald Trump Comments Shift Focus to Diplomacy

    Donald Trump said on April 20 that the deal now being negotiated with Iran would be better than the Joint Comprehensive Plan of Action, the 2015 accord he exited in 2018. His remarks came after criticism from Democrats and some nuclear experts who questioned whether a complex agreement could be reached quickly. The comments added a diplomatic angle to a market already focused on oil supply and ceasefire risk.

    At the same time, uncertainty around the next round of talks remained in place. Prospects for further negotiations in Pakistan were not clear as the two-week ceasefire neared expiry.

    Oil Volatility Keeps Pressure on Risk Assets

    Oil remained central to the market reaction. Reuters reported that the war and renewed disruption around Hormuz had helped lift global oil prices, with Brent and WTI both showing sharp gains. Higher energy prices can keep inflation concerns alive, which in turn can affect expectations for monetary policy and weigh on crypto demand.

    Bitcoin’s recent trading pattern gave back part of its earlier rally as geopolitical headlines worsened and crude rose again. Even with the recovery above $76,000, traders continued to monitor whether the market could hold support if oil stays elevated and diplomatic progress remains uncertain.

    Bitcoin Price Technical Levels

    Market structure also pointed to continued volatility. The earlier move above $76,000 had forced out a large amount of bearish positioning, but the weekend retreat triggered another round of liquidations as traders adjusted to the new macro backdrop. Open interest and options positioning around the $75,000 area suggested that Bitcoin could continue to see sharp price swings in the near term.

    Technical levels now remain important for the next move. Resistance sits near the upper $79,000 zone, while support was near $73,000 to $75,000.

  • Historic First Year: SEC Under Atkins Resets Crypto Policy With Focus on Clarity and Growth

    Historic First Year: SEC Under Atkins Resets Crypto Policy With Focus on Clarity and Growth

    The SEC is positioning its first year under Paul Atkins as a turning point toward clearer regulation and stronger markets. The SEC Chair described it as a historic year, stating the agency delivered on its promises.

    Key Takeaways:

    • SEC emphasized regulatory clarity as key to stronger U.S. capital markets.
    • Paul Atkins framed his first year as historic, with a focus on innovation and growth.
    • NYSE event reinforced policy shift supporting crypto and market competitiveness.

    ‘It’s Been a Historic First Year as SEC Chairman’

    A first anniversary appearance at the New York Stock Exchange (NYSE) highlighted the market impact of U.S. Securities and Exchange Commission (SEC) Chair Paul Atkins’ policy shift. On April 20, the SEC, Atkins, alongside supportive lawmakers and fellow regulators, cast the milestone as reflecting a year shaped by regulatory clarity, stronger U.S. capital markets, and support for innovation, including crypto.

    The SEC detailed that Atkins rang the NYSE opening bell to mark his one-year anniversary as chairman. The agency emphasized a shift toward regulatory clarity and a less enforcement-driven approach to crypto and other emerging technologies, while Atkins described the period as a “historic first year” focused on returning the SEC to its core mission of investor protection, orderly markets, and capital formation.

    Commodity Futures Trading Commission (CFTC) Chair Mike Selig stated that the SEC had “ended regulation by enforcement” and supported “innovative technologies like crypto,” while pointing to closer coordination between the CFTC and SEC. That signals clearer operating conditions for digital asset firms in the U.S., as policymakers continue emphasizing innovation, competitiveness, and regulatory alignment.

    Atkins was sworn in as the SEC’s 34th chairman on April 21, 2025, after President Donald Trump nominated him on Jan. 20, 2025, and the Senate confirmed him on April 9. The role marks Atkins’ return to the agency, where he previously served as an SEC commissioner from 2002 to 2008. During his current tenure, the SEC has signaled a more industry-friendly approach to digital assets through moves including support for its Crypto Task Force, the dismissal of civil enforcement actions against several crypto firms, and a broader push for clearer crypto guidance.

    Atkins Ties Crypto to SEC Core Mission

    The SEC chairman further stressed: “I promised a new day at the SEC when I came aboard … We’ve made huge progress,” he said, reiterating:

    “When I took office 1 year ago, I promised a new day at the SEC. And we’ve delivered.”

    “With our agenda to restore regulatory clarity, strengthen competitiveness, and accelerate innovation, we are making sure the U.S. remains the world’s strongest and safest place to invest,” he stated. Those remarks placed crypto within a broader market strategy while linking policy direction to competitiveness and investor safeguards.

    Echoing that stance, House Financial Services Committee Republicans said on X that the SEC advanced policy changes aligned with innovation, stronger U.S. capital markets, and investor protection, adding that “Republican members look forward to continue advancing these efforts.”