$XRP price has fallen steadily from around $3.65 in July 2025 to about $1.20 in June 2026, leaving many investors pessimistic.
Some analysts believe this could be more than just a normal decline. They think $XRP may be forming a bear trap — a situation where the price falls below an important support level, convincing traders it will keep dropping, only to suddenly reverse and move sharply higher.
If they are right, the recent sell-off could be trapping bearish traders before a major rally. The big question for $XRP holders is: Is this a genuine breakdown or the final shakeout before a strong upward move?
The Market Is Pricing Fear, But $XRP May Be Telling a Different Story
At first glance, $XRP’s recent price action looks bearish. It ended May 2026 at $1.33, fell to $1.29 on June 1, dropped again to $1.21 on June 2, and slipped into the $1.18 range by June 4.
In less than a week, $XRP lost about 11% of its value, while over $8 billion was wiped from its market capitalization during a crypto sell-off that also pushed Bitcoin to $61,300.
However, the activity behind the scenes tells a different story.
During the same period, more than 25 million $XRP were moved off exchanges, often a sign that investors are holding rather than preparing to sell. At the same time, the number of “whale” wallets holding 10,000 $XRP or more reached a record 332,230 addresses — the highest level ever recorded.
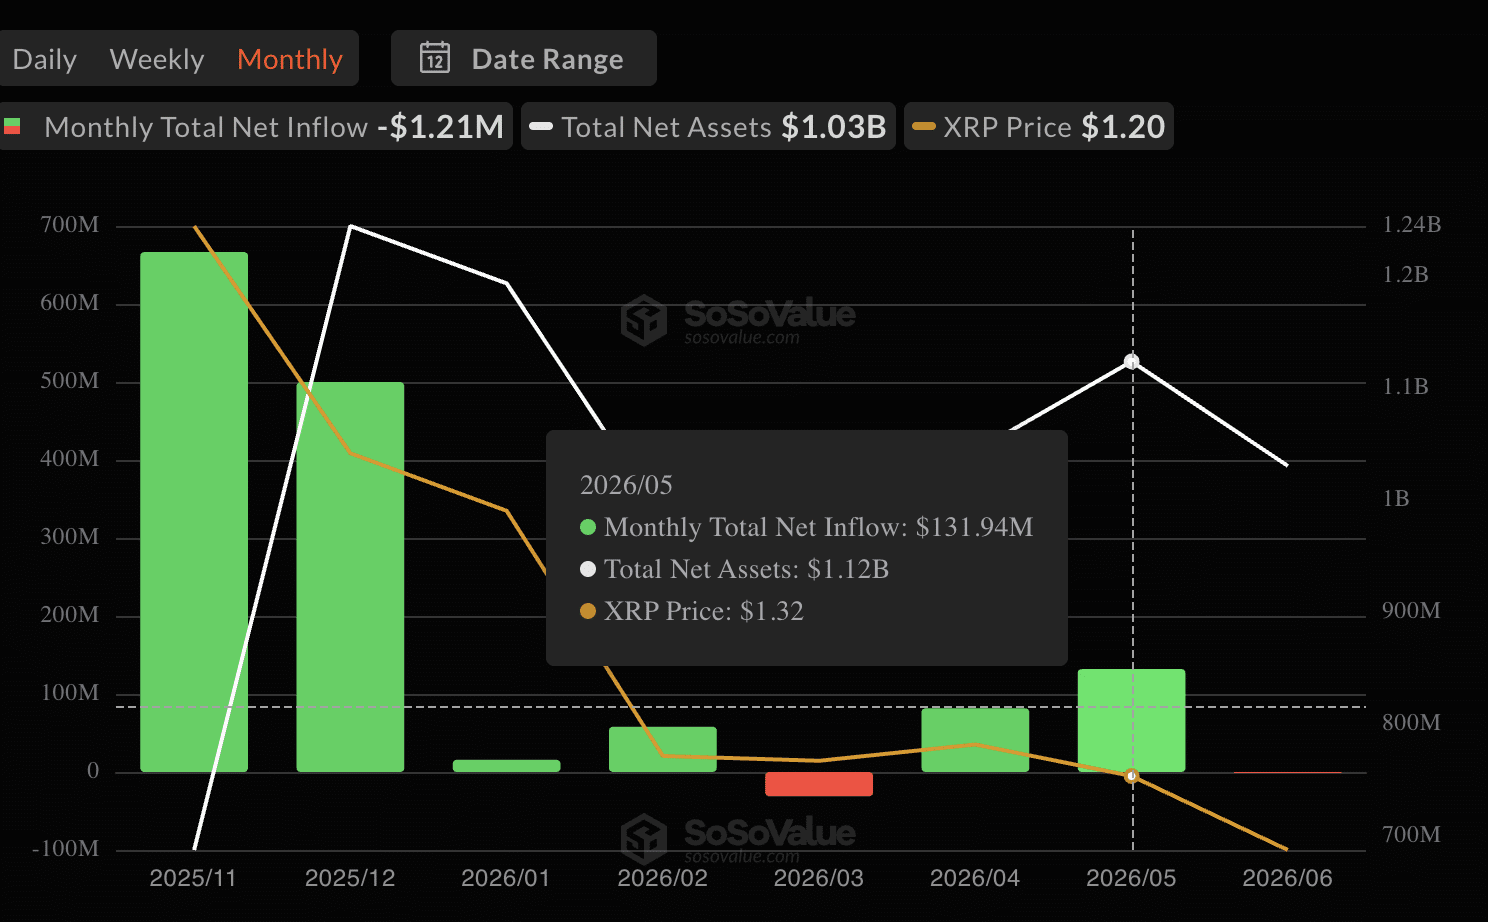
Institutional interest also remained strong. $XRP exchange-traded funds (ETFs) attracted a record $131.94 million in inflows for the year during May 2026.
The contrast is hard to ignore: while many retail investors appear fearful, large holders and institutional investors are increasing their exposure.
Why This Pullback May Be More of a Shakeout Than a Breakdown
A true long-term decline usually happens when all types of investors are selling — especially those with the most conviction, the longest investment horizons, and the deepest market knowledge.
That is not what we are seeing with $XRP right now.
Most of the selling appears to be coming from short-term traders reacting to falling prices and broader market weakness. Meanwhile, large holders, institutional investors, and ETF participants continue to accumulate or maintain their positions.
This distinction is important because it suggests the recent price drop may not be driven by weakening fundamentals.
In fact, $XRP’s broader ecosystem has continued to grow. In early 2026, Ripple secured more institutional partnerships, while the $XRP Ledger’s tokenized real-world asset market expanded to $3.5 billion, up from $991 million at the beginning of the year.
When prices fall despite improving adoption and continued institutional interest, it can indicate that the market is reacting more to short-term fear than to any meaningful deterioration in the asset’s long-term outlook. That is why some analysts view the current pullback as a strategic shakeout rather than the start of a deeper structural decline.
Selling Pressure Is Rising, Yet Support Refuses to Break
The $1.00–$1.20 range has now become the key support zone. $XRP has tested this area several times, yet it has not produced a decisive daily or weekly close below it. This indicates that demand remains active at these levels.
Technical indicators also suggest the sell-off may be becoming overextended. $XRP’s Relative Strength Index (RSI) has fallen to 27.55, an oversold level implying fading selling momentum. The Stochastic Oscillator is also deep in oversold territory.
Taken together, these signals suggest that while selling pressure remains strong, buyers are still defending critical support levels. This increases the likelihood of a relief rally if market sentiment improves.
The Disconnect Between Sentiment and Price Behaviour
One of the clearest signals right now is the difference between market sentiment and market positioning. Most traders are bearish, and short positions heavily outweigh long positions by about 9 to 1.
When so many people are on the same side of a trade, the risk of a short squeeze increases. If $XRP starts to recover due to positive news or another catalyst, short sellers may rush to buy back their positions to limit losses. That buying can push prices up faster and further than normal market demand would.
What Makes This Correction Different From Previous Declines
$XRP is down about 66% from its July 2025 peak, which looks similar to previous bear-market declines. However, the market around $XRP has changed significantly.
Unlike past downturns:
- Spot $XRP ETFs now exist and have attracted about $1.43 billion in inflows since launching in November 2025.
- Goldman Sachs has disclosed a $153.8 million position in $XRP ETFs.
- The CLARITY Act, which would formally classify most crypto assets as a digital commodity, has advanced through the Senate Banking Committee.
- Ripple has received conditional approval for Ripple National Trust Bank and has applied for a Federal Reserve master account.
These developments were not present during earlier $XRP crashes. As a result, the $XRP ecosystem in June 2026 is much more developed and institutionally connected than in previous market cycles.
$XRP’s Current Setup Resembles a Transfer of Conviction
Markets rarely move directly from a downtrend to an uptrend. Instead, there is usually a transition period in which investors who are losing confidence sell to those who are becoming more confident. This phase is often called accumulation, and current on-chain data suggests $XRP may be in that stage.
Weak Holders Are Selling
Much of the recent selling comes from investors who bought $XRP during the rally that peaked around $3.65. Earlier in 2026, data showed that about 60% of $XRP’s circulating supply was held at prices above the current market value. This means many investors were holding losses and were likely to sell whenever the price approached their entry point.
As a result, every small price recovery tends to face selling pressure from holders trying to break even. This creates resistance and keeps the price from moving higher. The cycle usually continues until most of these sellers have exited the market.
Long-Term Investors Are Holding
While short-term traders are selling, larger and longer-term holders appear to be staying invested.
The number of whale wallets holding at least 10,000 $XRP has reached a record high. At the same time, more than 2 billion $XRP has been moved off exchanges since October 2025 into cold storage, making it less likely to be sold in the near term.
Institutional investors also seem to be accumulating. $XRP ETFs recorded their strongest monthly inflows in May 2026 even as the token’s price was falling, suggesting steady buying rather than emotion-driven trading.
Signs That Often Appear Before Bigger Moves
Another important signal comes from the derivatives market. Open interest remains high, while funding rates have turned negative. This means short sellers are paying to keep their positions open, making bearish bets more expensive over time.
Meanwhile, whale withdrawals from Binance have fallen to their lowest level since 2021. In previous bull markets, large holders moved much larger amounts of $XRP. The current low activity suggests they are not preparing to sell and are instead waiting for better market conditions.
In other words, weaker short-term holders are selling, while larger, longer-term investors continue to hold. If this continues and selling pressure fades, $XRP could be building the foundation for its next major move higher.
The Hidden Battle Taking Place Around $XRP’s Key Range
Every big price move starts with a fight between buyers and sellers. For $XRP, that fight is happening between $1.20 and $1.34.
Buyers Are Holding the Line
The $1.20 level is the most important support right now. If $XRP closes below it, many analysts believe the price could fall toward $1.00. So far, however, buyers have repeatedly stepped in to defend this area.
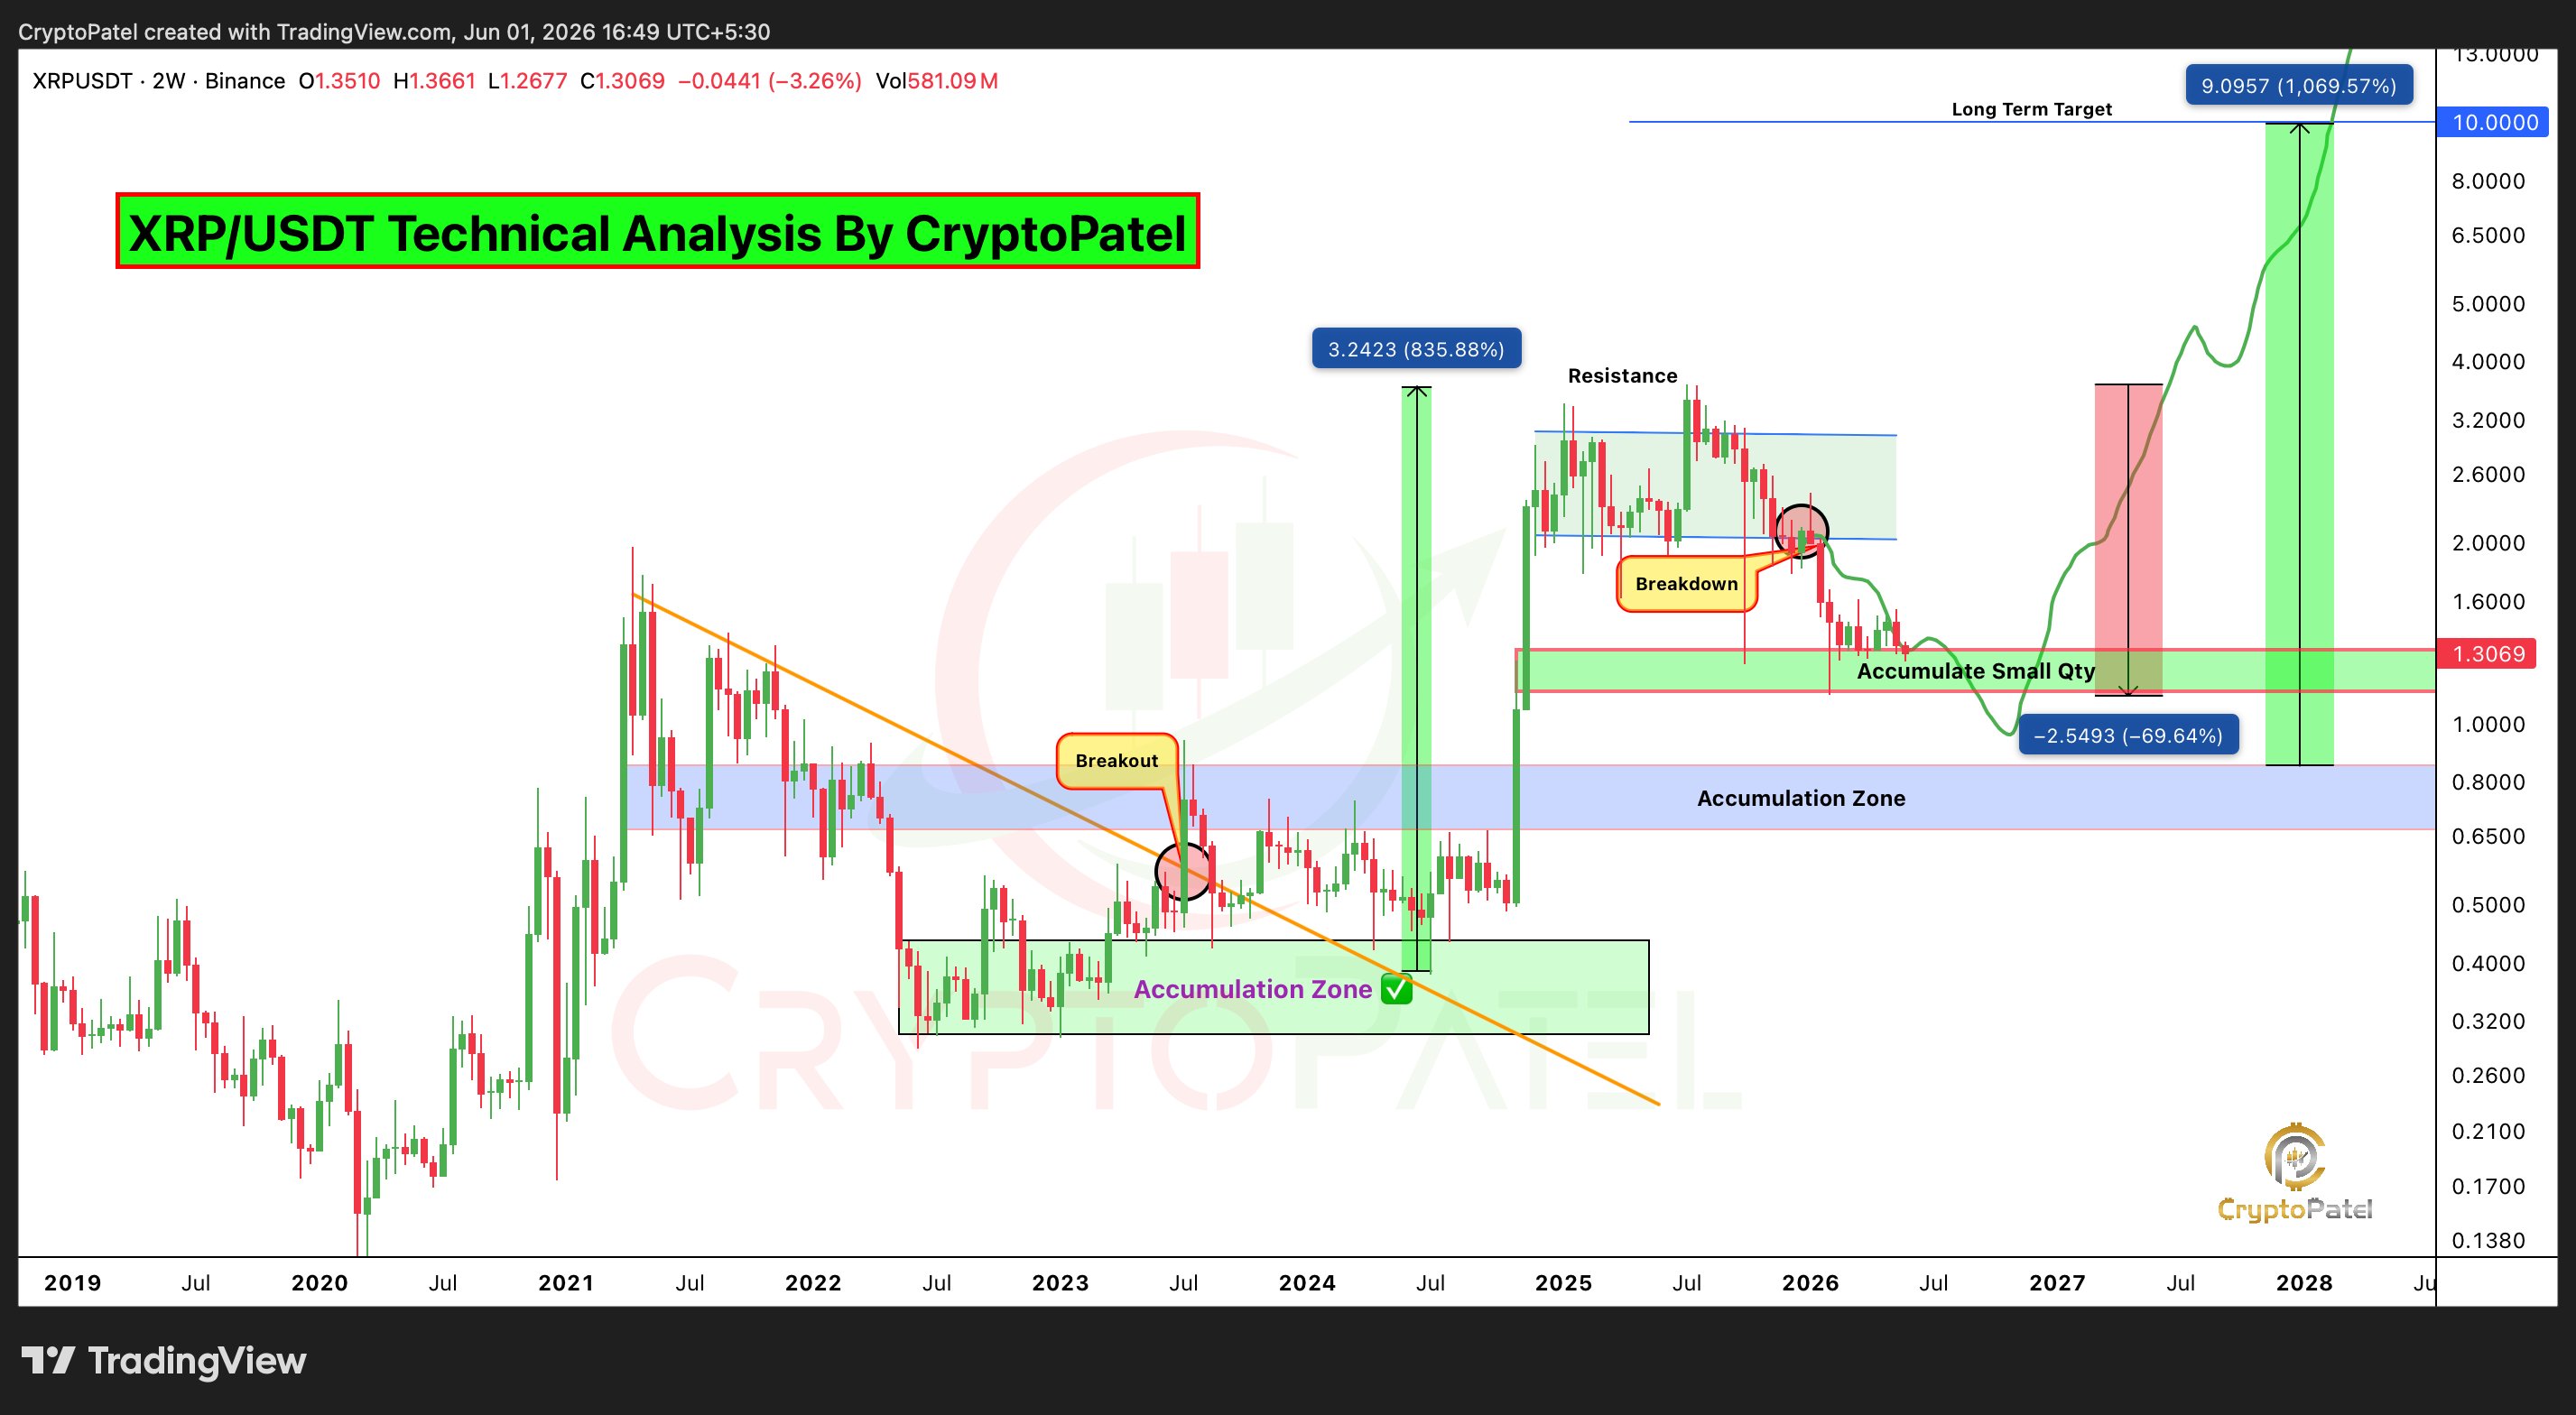
Analyst Crypto Patel considers $1.10–$1.30 a major accumulation zone. He believes a drop below it could eventually open the door to prices between $0.65 and $0.85, although that would likely require significant selling pressure.
Rejections Don’t Always Mean Weakness
$XRP has struggled several times to move above $1.25–$1.30, with sellers pushing the price back down. At first glance, this looks bearish.
However, when a market remains in a tight range for a long time without breaking lower, it can mean that buyers are quietly absorbing selling pressure. Strong market bottoms are often formed during these uncertain periods rather than through a quick reversal.
Why This Tight Range Matters
$XRP has been trading in a very narrow range for months. Around 60% of its 2026 trading activity has taken place between $1.30 and $1.50. Options data from Deribit also points to $1.40 as a key level for the June expiry.
When prices remain compressed for a long period, it often leads to a larger move later. $XRP has formed patterns such as symmetrical triangles and falling wedges, which typically end with a strong breakout or breakdown.
The longer $XRP stays trapped in this range, the bigger the eventual move is likely to be.
What Happens If Sellers Lose Control?
Bear markets do not usually end with a big announcement. They end when most people who wanted to sell have already sold, leaving mainly investors willing to hold.
Why Short Sellers Could Fuel a Rally
Current market data shows that short positions outnumber long positions by roughly 9 to 1.
Short sellers borrow $XRP and sell it, hoping to buy it back later at a lower price. But if the price rises instead, they are forced to buy $XRP back to limit losses.
With so many traders positioned short, a small positive catalyst could trigger a short squeeze — a rapid rise caused by short sellers rushing to buy back their positions. Historically, some of $XRP’s sharpest rallies have been driven by this type of setup.
What $XRP Needs for a Lasting Recovery
A short squeeze can create a quick price spike, but it does not guarantee a long-term uptrend. For a sustained recovery, three things need to happen:
- Selling pressure from existing holders must continue to decline.
- A positive catalyst must improve market sentiment.
- Trading volume must increase, showing that real buyers are supporting the move.
One potential catalyst is progress on the CLARITY Act, which is moving toward a Senate vote before the August recess.
Until a clear catalyst emerges, the market may still test lower support levels, with $1.14 remaining an important area to watch.
$XRP’s Path to Liftoff Depends on More Than Price Alone
Price charts only show the result of what is happening behind the scenes. To understand $XRP’s long-term potential, it is important to look at network growth, institutional adoption, and major regulatory developments.
Network Activity Trends Worth Monitoring
The $XRP Ledger’s tokenized real-world assets grew from $991 million at the start of 2026 to $3.5 billion by early June — more than tripling in six months. This makes XRPL one of the leading platforms for institutional tokenization outside of Ethereum.
As more assets are tokenized on the network, demand for $XRP increases because it is used to move value across the ledger.
Another major development was the launch of CME’s 24/7 $XRP futures market in June, with Ripple Prime as a key partner.
Around-the-clock regulated futures trading gives institutions easier access to $XRP, improves price discovery, and strengthens $XRP’s position as a recognized financial asset.
Institutional Payment Narratives and Market Attention
Ripple continued to build momentum in 2026. The company expanded its policy efforts in Washington, D.C., as lawmakers considered new crypto legislation. It also completed a tokenized U.S. Treasury pilot with J.P. Morgan, Mastercard, and Ondo Finance on the $XRP Ledger.
Meanwhile, Ripple’s RLUSD stablecoin reached $1.8 billion in market value after expanding to Ethereum Layer-2 networks.
Together, these developments support $XRP’s role in payments and settlement. Standard Chartered analyst Geoffrey Kendrick has maintained an $8 year-end target for $XRP, assuming the CLARITY Act passes and ETF inflows continue to grow.
Catalysts That Could Change Everything
The biggest near-term catalyst is the CLARITY Act. If passed, it would officially classify $XRP as a digital commodity rather than a security. This could remove a major barrier that has kept many institutions from investing directly in $XRP.
The bill passed the Senate Banking Committee with bipartisan support in May 2026, and a Senate vote before the August recess could be a pivotal moment.
Another important factor is Ripple’s application for a Federal Reserve master account. Approval would give Ripple direct access to the Fed’s payment infrastructure, potentially making $XRP part of the financial system itself rather than simply connected to it. While timing remains uncertain, the implications could be significant.
Three Outcomes That Could Define $XRP’s Next Chapter
Markets eventually resolve uncertainty, and $XRP currently has three realistic paths ahead.
Scenario 1: A False Breakdown Followed by a Strong Recovery
In this scenario, $XRP briefly falls below $1.20, possibly reaching $1.13 to $1.00, before buyers step in and drive the price higher. As short sellers rush to cover their positions, $XRP could reclaim $1.25 and then $1.30, shifting market sentiment back to bullish.
A Senate vote on the CLARITY Act during this period could act as a major catalyst, helping $XRP move toward the $1.56 target suggested by Monte Carlo models, with even greater upside possible if ETF inflows increase.
This is the outcome supporters of the “bear trap” theory expect. The setup may already be in place; the key question is whether a catalyst arrives.
Scenario 2: Sideways Trading Continues
The most likely outcome, according to simulation models, is that $XRP remains stuck in a range between $1.20 and $1.46 throughout June. In this scenario, buying and selling pressure stay balanced, preventing a clear breakout or breakdown.
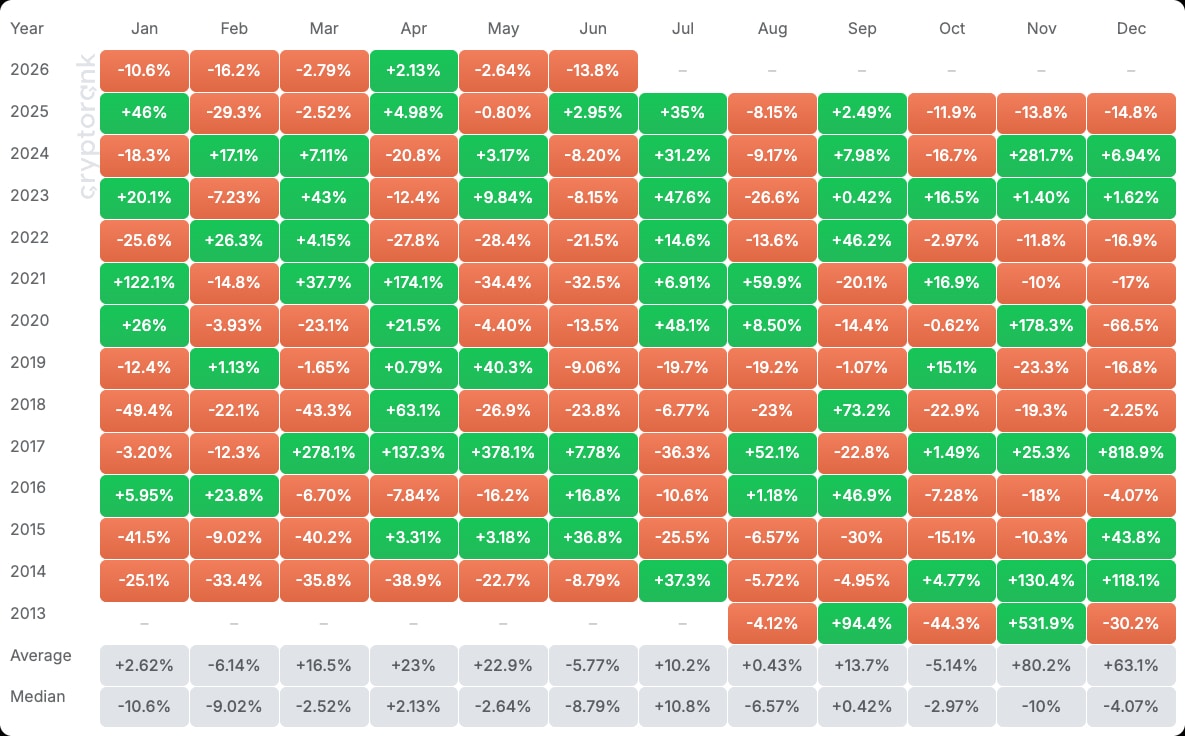
Since June has historically been a weak month for $XRP, the price could simply move sideways until a stronger catalyst emerges.
This outcome does not confirm or disprove the bear trap theory. It simply delays the answer. The longer $XRP consolidates, the more significant the eventual move could be.
Scenario 3: Bears Take Control
If $XRP closes below $1.20 with strong selling volume, it would signal a more serious breakdown. The next downside targets would be around $1.00 and then the important psychological level at $0.90.
If the CLARITY Act loses momentum or institutional demand weakens, models estimate about a 35% chance of this bearish outcome.
In this case, recent buying by whales and ETF investors may prove to have come too early. Some analysts believe a stronger long-term buying opportunity could emerge in the $0.65 to $0.85 range. While this is not the most likely scenario, it remains a risk investors should consider.
Why the Next Few Weeks May Matter More Than the Last Few Months
The next three to four weeks may be more important for $XRP than the last several months. By then, investors should have a much clearer picture of the CLARITY Act’s progress in the Senate.
At the same time, a large number of options contracts expire on June 26, with the “max pain” level around $1.40. This could create pressure for $XRP’s price to move toward that level as the expiration date approaches.
History also offers a reason for optimism. Similar market setups in 2020, 2023, and 2024 were followed by $XRP forming a bottom and beginning a recovery. Today’s conditions closely resemble those earlier periods.
Another positive sign is that selling pressure from investors who bought $XRP at higher prices between $1.50 and $3.65 is gradually easing.
The longer $XRP avoids a major breakdown, the less impact these sellers are likely to have on the market, making it easier for new demand to push prices higher.
Is This Just Another Dip or the Last Pullback Before a Bigger Move?
No one can answer that with certainty.
Major turning points in markets are often unclear in real time. If everyone knew what would happen next, the opportunity would already be reflected in the price.
What investors can evaluate is the overall setup. Right now, $XRP has several factors working in its favor: growing institutional infrastructure, significant whale accumulation, heavy short interest, upcoming regulatory catalysts, and strong business progress from Ripple despite a roughly 66% decline from previous highs.
None of these factors guarantee a rally. However, they suggest that the potential upside may be significantly larger than the downside risk. While a bear trap is far from certain, the odds appear higher than they typically are in most market conditions.
Key Takeaways From $XRP’s Current Market Position
$XRP is trading near $1.20 in early June 2026, down about 66% from its July 2025 high of $3.65 as the broader crypto market remains under pressure. Despite the decline, on-chain data shows growing investor interest.
Whale wallets holding at least 10,000 $XRP have reached a record 332,230 addresses, more than 25 million $XRP have recently left exchanges, and $XRP ETFs attracted a record $131.94 million in inflows during May.
Many traders are betting against $XRP, with short positions outnumbering longs by about 9 to 1. This raises the risk of a short squeeze if the price moves higher. $XRP’s RSI is around 27, indicating oversold conditions. The $1.20 level is a key support area. A daily close below it could open the door to declines toward $1.14 and potentially $1.00.
One of the biggest near-term catalysts is the CLARITY Act. The bill passed the Senate Banking Committee with bipartisan support in May 2026. A Senate floor vote before August could have a major impact on $XRP’s price and market sentiment.
Meanwhile, the $XRP Ledger’s tokenized real-world asset market has grown to $3.5 billion. CME launched 24/7 $XRP futures on June 3, and Ripple continues to expand its institutional partnerships.
So far, these developments have not led to a lasting price rally. Some analysts view this disconnect as a sign that the market may be underestimating $XRP’s long-term potential.
Frequently Asked Questions
Why are traders talking about an $XRP bear trap?
$XRP dropped below key support levels in early June 2026, which encouraged many traders to open short positions. However, on-chain data shows large investors are still accumulating $XRP, ETF inflows remain strong, and the derivatives market is heavily skewed toward shorts. When price falls but underlying data stays positive, traders often view it as a potential bear trap that could trigger a sharp rebound.
What would invalidate the bear trap theory?
The bear trap idea would weaken if $XRP closes below $1.20 on strong selling volume. It would also be a negative sign if whale accumulation slows or $XRP ETFs start seeing outflows. Delays to the CLARITY Act or a broader crypto market decline, such as Bitcoin dropping well below $60,000, could further reduce the chances of a recovery.
Which price levels matter most right now?
The key level to watch is $1.20. A daily close below it could send $XRP toward $1.00 and then $0.90. On the upside, $XRP needs to reclaim $1.25 first, as that level recently turned from support into resistance. A move above $1.34 with strong volume would increase the chances of a rally toward $1.45.
Can $XRP rally without major news?
Yes. A short squeeze can push prices higher even without a major catalyst. Since short positions currently far outweigh long positions and funding rates are negative, the conditions for a squeeze exist. However, for any rally to last, $XRP will likely need stronger demand or a positive catalyst, such as progress on the CLARITY Act.
Why do failed breakdowns often lead to strong rebounds?
When traders short an asset expecting further declines and the price suddenly reverses, they are forced to buy back their positions. This buying can accelerate the rally, especially when many traders are caught on the wrong side of the move. As a result, rebounds after failed breakdowns are often faster and stronger than the initial decline.
Leave a Reply