Crypto Rover, a prominent YouTuber and Bitcoin analyst, shares why he believes this may be one of the best Bitcoin bear markets ever.
The market pundit discussed this while sharing historical data surrounding drawdowns from previous Bitcoin bear markets. Specifically, the data confirms that despite the overly sour sentiment, Bitcoin’s lowest drawdown so far this season has been an improvement from past bearish phases.
Key Points
- Crypto Rover calls the current Bitcoin downturn one of the best bear markets ever.
- The ongoing bear market began around October 2025 and has lasted about seven months, with weak market sentiment.
- Bitcoin trades around $78,000, about 38% below its $126,000 all-time high in this cycle.
- The lowest price so far is $59,930 in February 2026, marking a 52% drawdown from the peak.
- Past cycles saw deeper losses, with declines between 70% and 85% before reaching their final bottoms.
Current Bitcoin Drawdown Remains Historically Low
The ongoing downturn began around October 2025 and has now stretched to roughly seven months, pushing sentiment into bearish territory. Despite this negative mood, the data suggests that the damage remains relatively limited.
Crypto Rover’s chart shows that the present cycle has only recorded drawdowns of about 42% to 52% more than 190 days after the all-time high. Even as the timeline progresses, the decline remains moderate.
Specifically, at the time of the snapshot on April 15, 2026, Bitcoin traded at $74,836. This price indicated that the cycle’s drawdown stood at 40% from the all-time high of $126,000, attained in early October 2025.
At press time, Bitcoin changes hands at $78,000, which implies a 38% drop from the cycle high. The lowest point so far came in early February 2026, when the price fell to $59,930. This level represents a 52% decline from the peak. Even at this lowest point, the drawdown remains much less severe than what previous cycles experienced.
If the $59,930 level ultimately marks the bottom of this cycle, it would confirm that Bitcoin avoided the deeper corrections typical of past bear markets. Notably, the current cycle has not reached a 55% decline at any stage, confirming how this downturn has been unusually mild.
Historical Data Around Past Drawdowns
For context, the chart compares different Bitcoin cycles by using percentage drops instead of actual prices. Each cycle starts at Day 0, which marks the exact day Bitcoin reached its all-time high for that period.
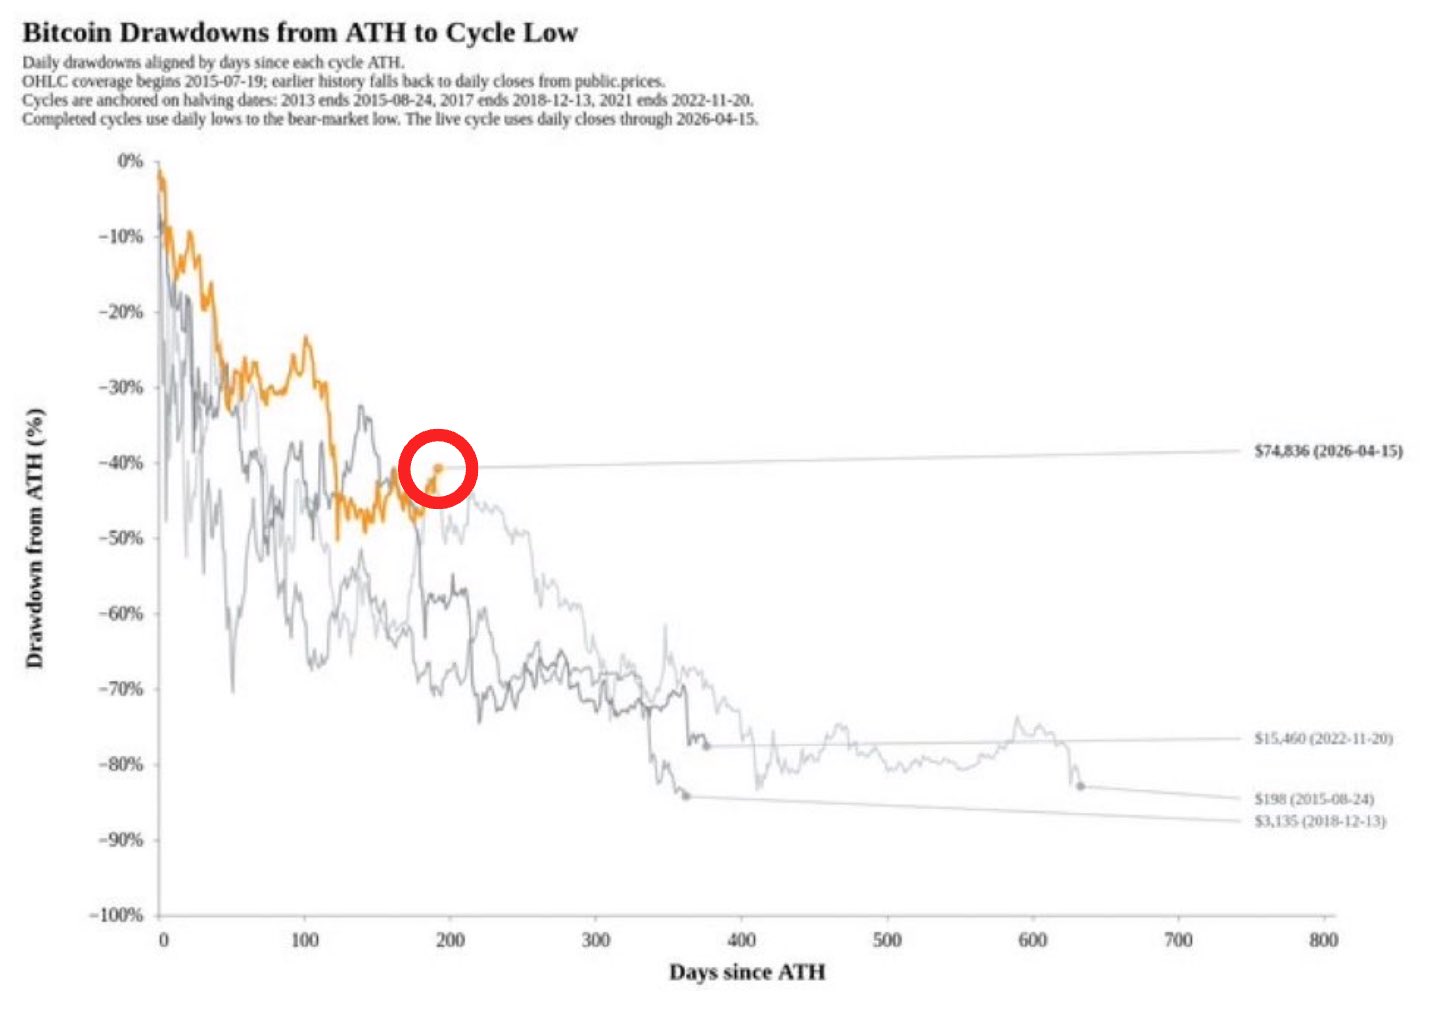
From there, the chart calculates the decline by dividing the current price by the all-time high price, minus 100%. In this model, 0% means the price is still at its peak, while negative values show how far it has fallen.
Historical comparisons confirm why Crypto Rover called this phase one of the best Bitcoin bear market phases. Earlier cycles consistently recorded drawdowns between 70% and 85%. By 300 to 400 days after their peaks, most past cycles had already dropped between 70% and 80%.
The 2015 cycle hit $198, an 82% decline. The 2018 cycle reached a low of $3,135, translating to an 84% drop. Meanwhile, the 2022 cycle ended at $15,460, with a drawdown of roughly 77%. These declines occurred over periods ranging from 300 to 700 days, with prices remaining deeply suppressed for extended durations.
A Mild Bitcoin Bear Market… For Now
Essentially, Bitcoin’s current downturn remains historically mild. The data shows that the asset has avoided the extreme losses recorded in past cycles. This confirms the claim that the ongoing bear phase ranks among the least damaging on record.
However, there is still uncertainty. While the current drawdown sits at 38%, the cycle has not yet fully concluded. Bitcoin’s future price action could still push prices to new lows, potentially changing the narrative. For now, though, the evidence indicates that this is one of the most resilient bear markets Bitcoin has ever experienced.
Leave a Reply