Tag: CRYPTOS FoxBusiness.

  • Crypto Market Review: Shiba Inu (SHIB) Took Worst Hit in 2026, Ethereum (ETH) Will Be Brutally Tested, Is Solana (SOL) on the Edge of a Volatility Implosion?

    Crypto Market Review: Shiba Inu (SHIB) Took Worst Hit in 2026, Ethereum (ETH) Will Be Brutally Tested, Is Solana (SOL) on the Edge of a Volatility Implosion?

    Throughout 2026, Shiba Inu has become one of the most stressed assets on the cryptocurrency market. The token’s price structure is severely weakened as a result of its inability to regain any significant momentum following months of continuous decline.

    Trend flipping

    The asset has been dominated by a broader bearish trend this year, which has been reinforced by the failure of even brief recovery attempts to produce long-term upside.

    $SHIB is currently trading close to the $0.0000056 range, which shows how far the token has dropped from its prior highs. The chart unequivocally demonstrates a recurring pattern of lower highs and lower lows, indicating that sellers are still in complete control of the market. The asset has not been able to establish a steady upward trend because every attempt at recovery has been met with fresh selling pressure.

    Article image

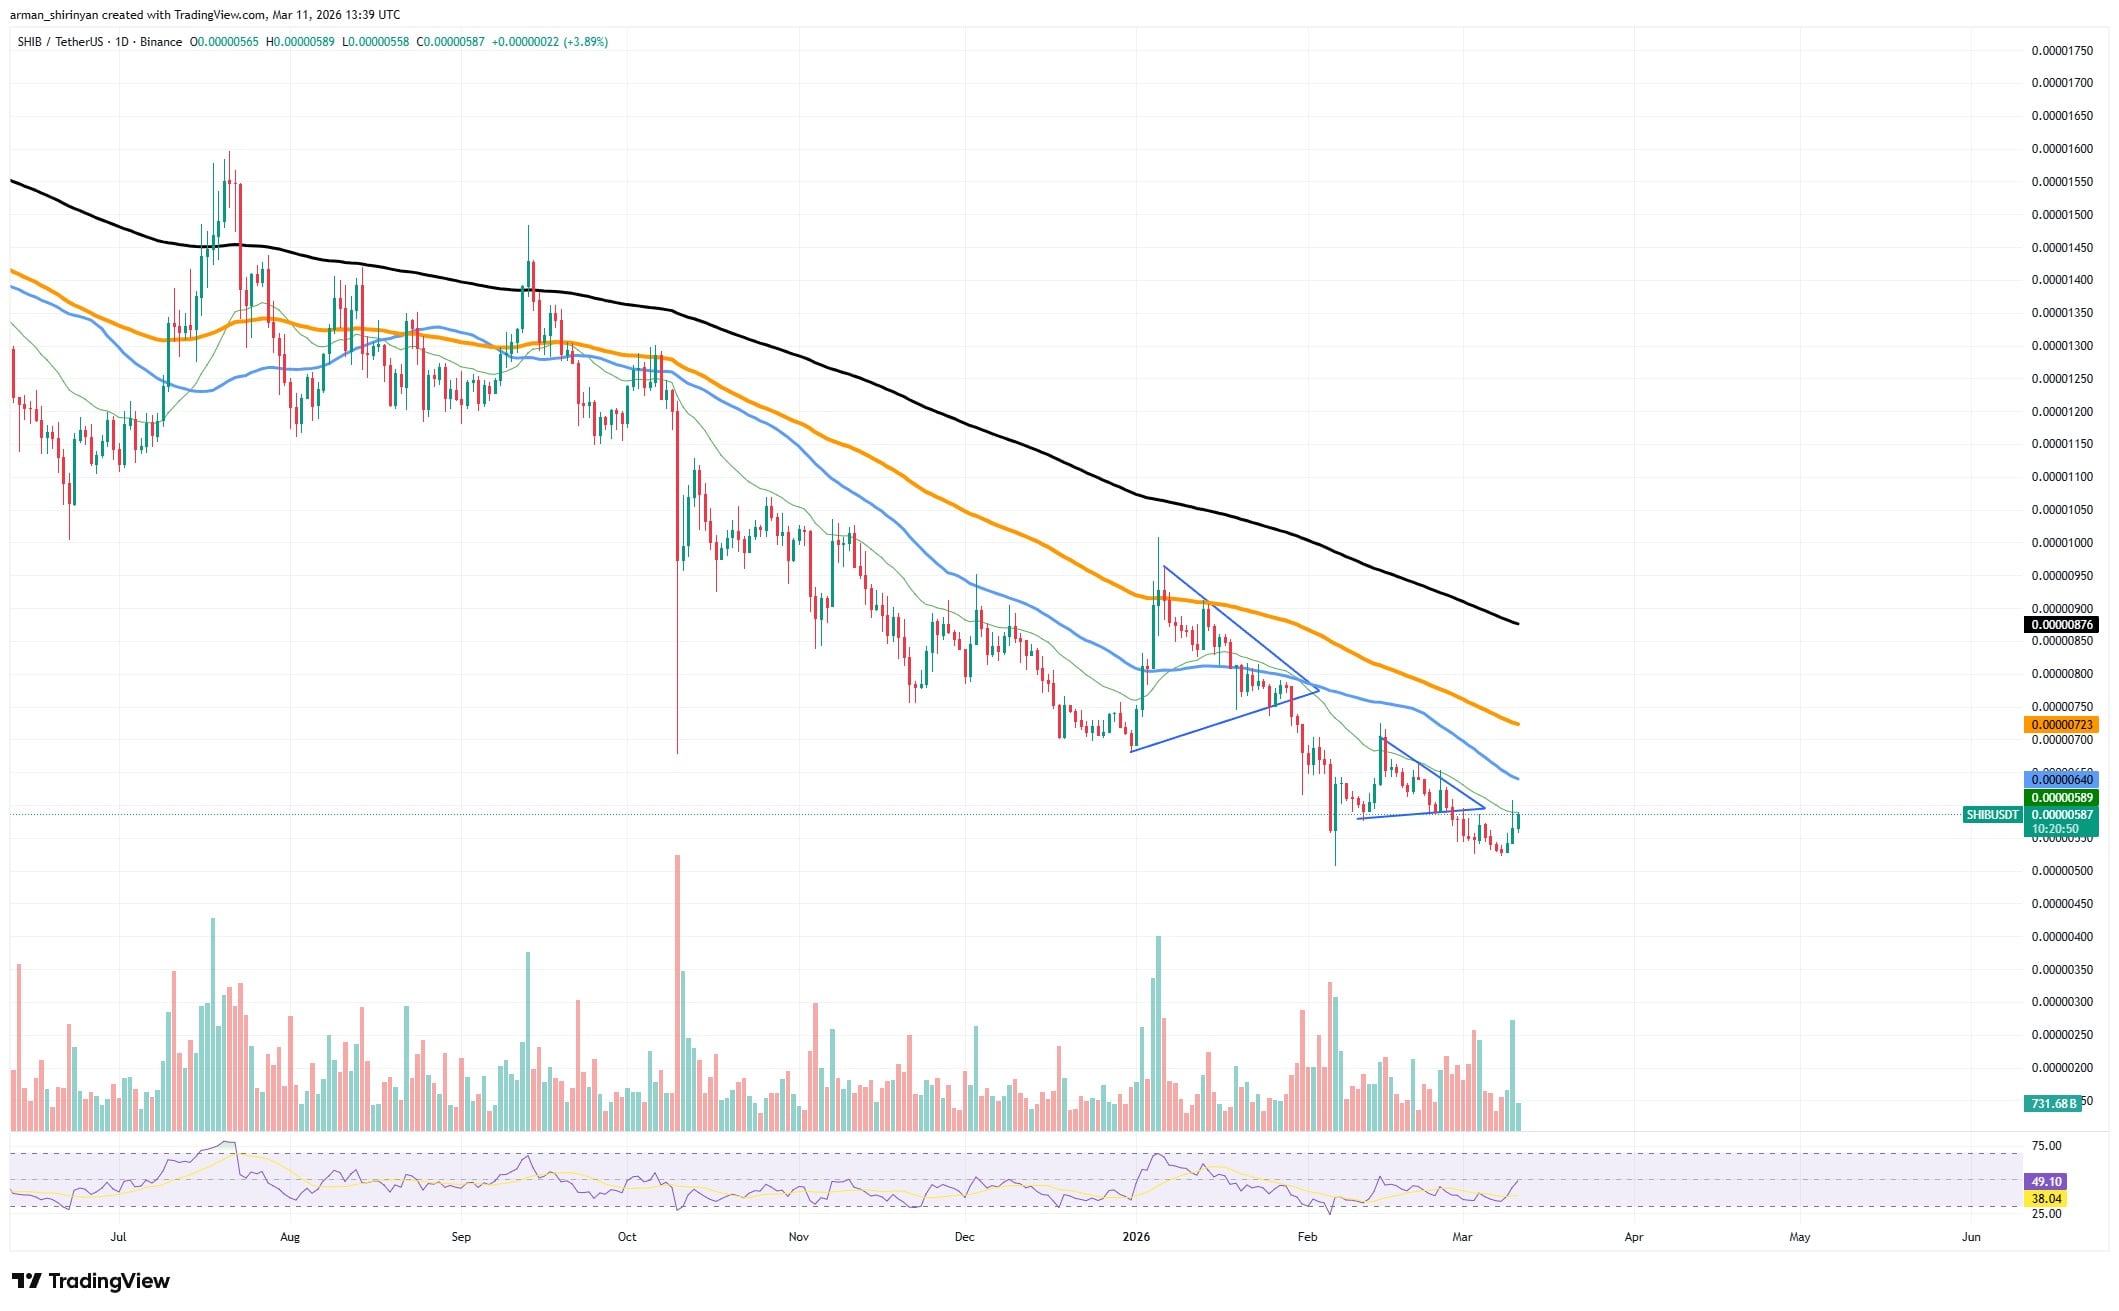
    The recent fakeout rally, which briefly hinted that $SHIB might be getting ready for a comeback, was one of the most telling moments. After rising above local lows, the price got close to the 26-day exponential moving average, which was its first significant technical barrier. For a brief while, it seemed like buyers were at last making progress.

    Shiba Inu gets rejected

    But that optimism was short-lived. The entire move was a classic fakeout since $SHIB was firmly rejected rather than overcoming the resistance. Even the earliest stage of a possible trend reversal is currently unattainable, as demonstrated by the failure at the 26 EMA.

    Fakeouts of this kind can be especially detrimental to market confidence. When a move fails, traders who entered positions anticipating a breakout are frequently compelled to exit, which can increase selling pressure. The rejection, in $SHIB‘s case, supported the notion that the larger downward trend is still present.

    The future appears uncertain. The market will probably continue to be under pressure as long as the price stays below major moving averages. Although short-term rallies are still possible, particularly if the overall cryptocurrency market stabilizes, they might not be able to turn into long-term recoveries.

    Ethereum’s stabilization chances

    As the asset tries to stabilize following months of intense selling pressure, Ethereum is nearing another crucial point. The $2,000 mark is no longer the primary psychological or technical barrier for Ethereum, despite the market’s recent temporary stability in that area.

    The 26-day exponential moving average, which presently serves as the most important resistance zone, is where the actual battlefield is located higher on the chart.

    Article image

    Ethereum has been stuck in a distinct downward structure for a number of months. The price chart consistently displays lower highs and lower lows, indicating that the general trend is still bearish. The asset has not been able to develop sustained upward momentum because every attempt at recovery has been stopped by declining resistance.

    For traders earlier in the cycle, the $2,000 mark held great psychological significance. Because they represent important sentiment thresholds, round numbers have historically drawn attention.

    Recent price trends, however, indicate that the market has already reached this level. Earlier this year, Ethereum briefly broke below it. Since then, it has traded around that level without producing the strong reactions that typically accompany a significant psychological barrier.

    The 26 EMA, where selling activity seems to be concentrated, is now Ethereum’s true challenge. Sellers swiftly surface and drive the market back down each time the price gets close to this moving average. This pattern suggests that a lot of traders use the 26 EMA as a crucial decision point, either to open new short trades or to close long positions.

    A break above the 26 EMA would indicate a change in short-term momentum and possibly pave the way for a more significant recovery move. But for the time being, Ethereum is still constrained by a number of barriers.

    Solana’s tighter market range

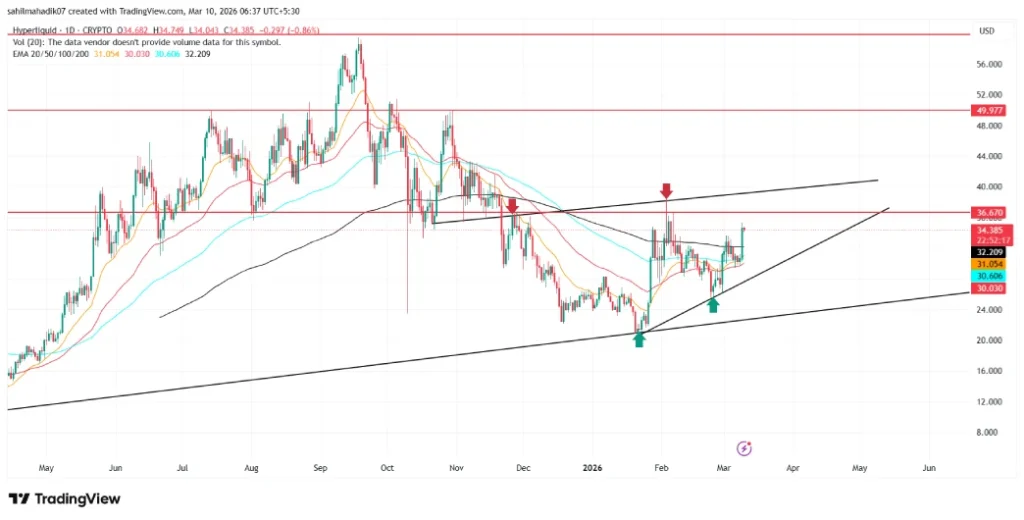
    Solana is about to enter a technical phase that might cause volatility to spike. The asset is starting to stabilize close to local lows after months of decline and frequent rejection by major moving averages. Even though the price is still relatively stable, a number of indicators point to the possibility that the market is getting ready for a much bigger move.

    Article image

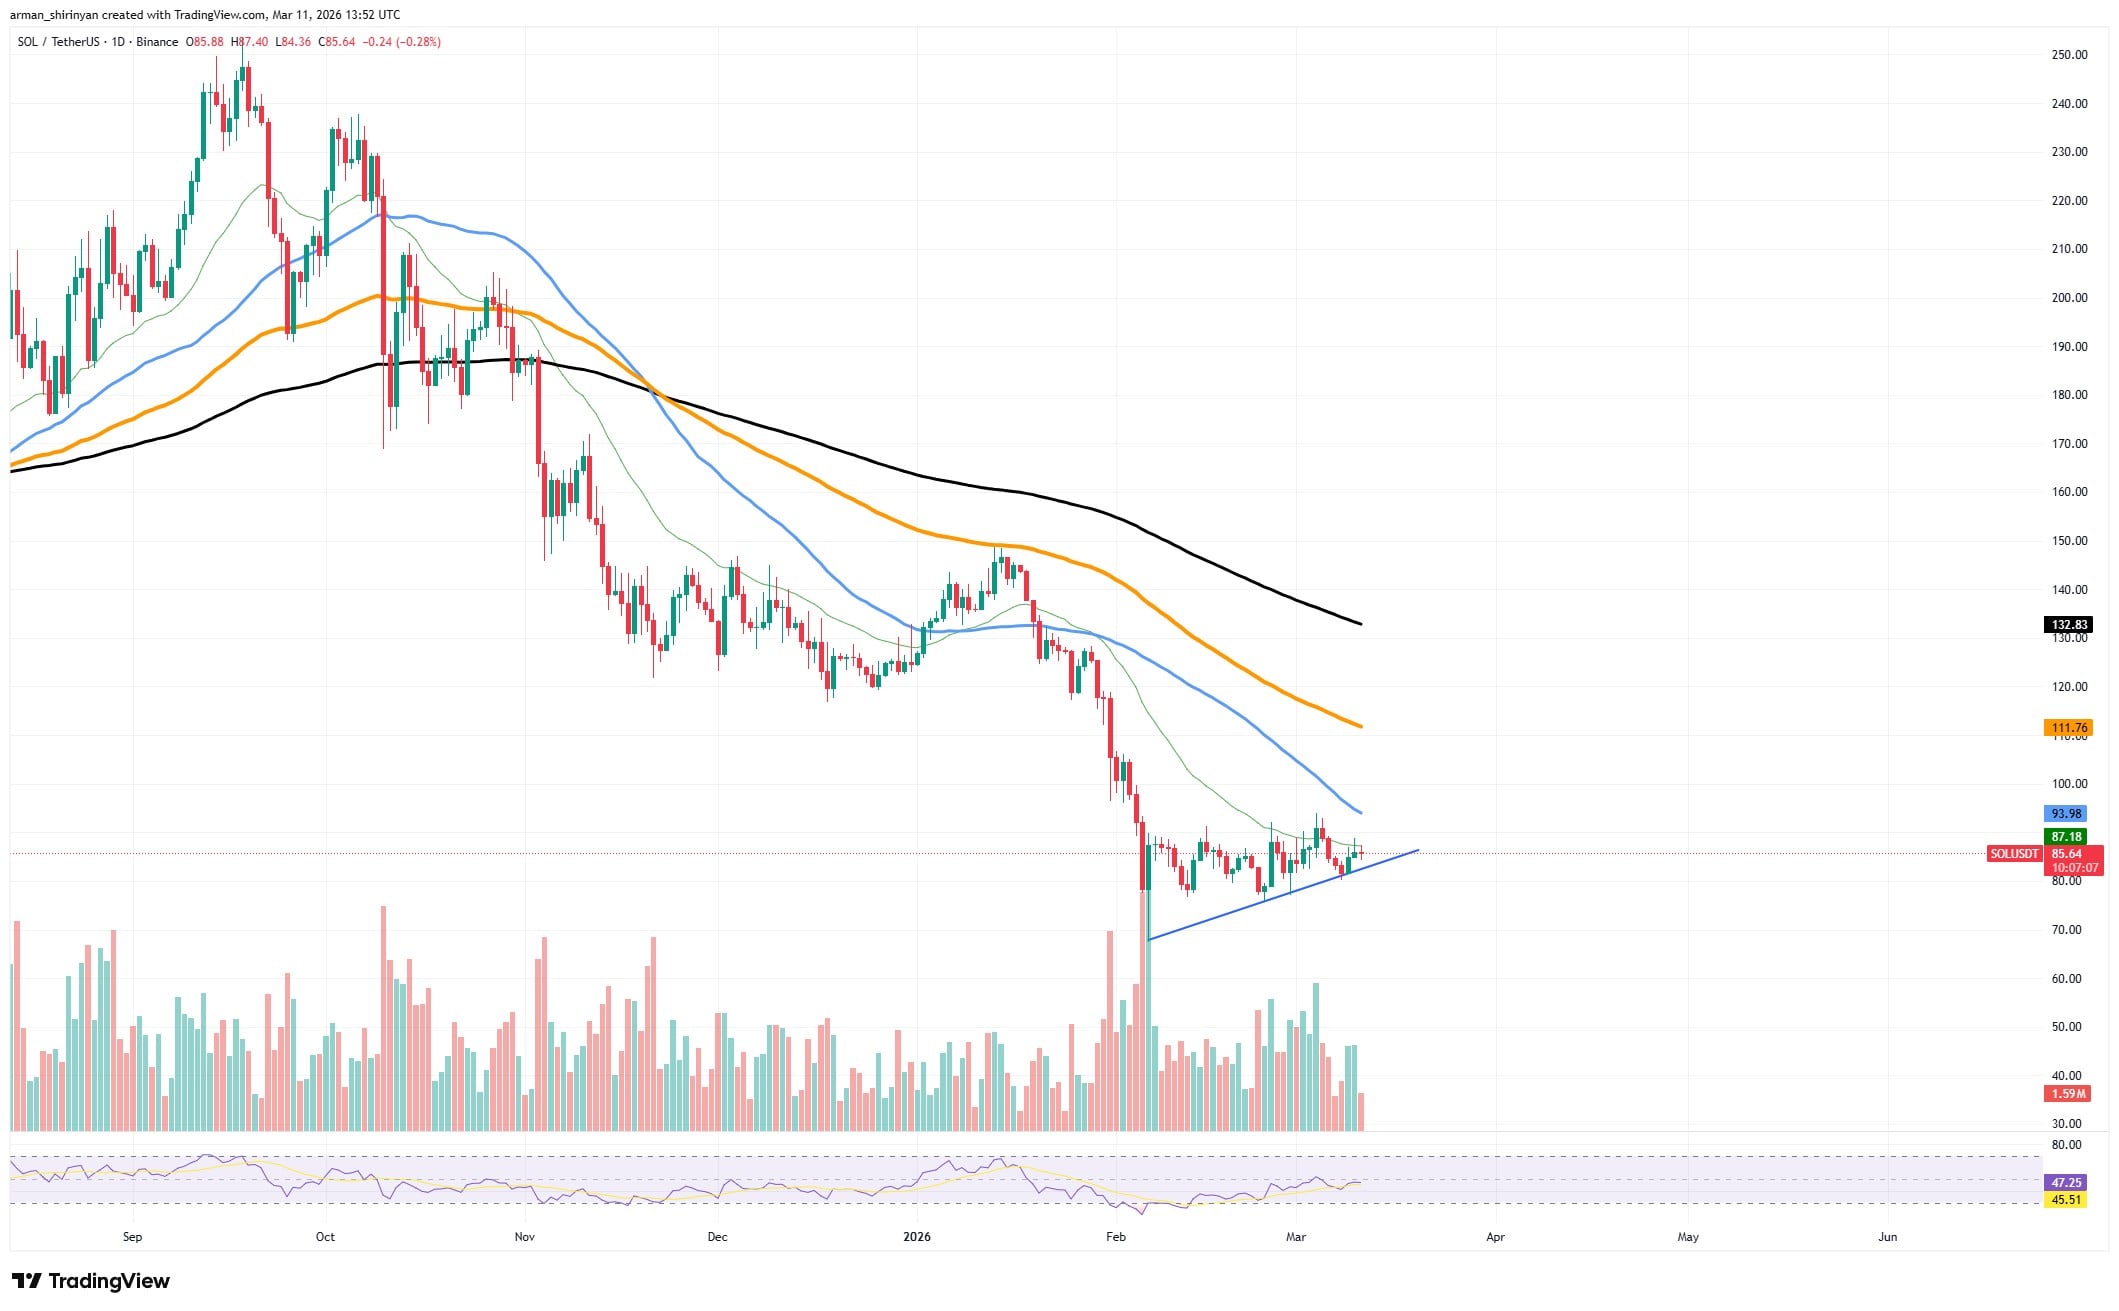
    Solana is currently trading between $85 and $87, consolidating following a sharp decline that began earlier in the year. The 50-day, 100-day and 200-day moving averages are all above the price, indicating that the overall trend is still obviously negative. These levels support the longer-term downward trend and continue to serve as significant resistance zones.

    Solana is forming higher lows along a rising support line, forming a tightening range, according to recent price action. This kind of compression frequently heralds an impending expansion in volatility, particularly following extended downward pressure.

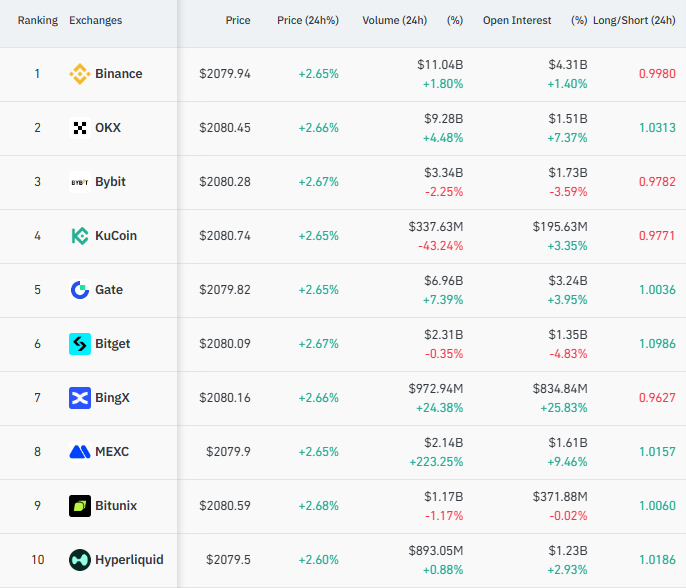
    Solana derivates staying up

    This possibility is supported by CoinGlass derivative data. There has been a noticeable increase in futures activity around Solana, as traders position themselves for a more significant directional move. Despite the comparatively muted price movement, market participants are becoming more active, according to metrics pertaining to open interest and trading flows.

    Solana has not yet confirmed a breakout in spite of these signals. The fact that the price is still stuck in a small range indicates that the market is still applying pressure rather than releasing it. The duration of this stabilization phase may vary, but the final breakout is typically stronger the longer the compression lasts.

  • Crypto Traders Turn to Hyperliquid for Oil Bets Amid Iran Volatility

    Crypto Traders Turn to Hyperliquid for Oil Bets Amid Iran Volatility

    Crypto traders are increasingly using the DeFi derivatives platform Hyperliquid to speculate on oil prices, in the latest sign that always-on crypto markets are beginning to absorb trading tied to global macro shocks.

    Oil-linked perpetual futures on Hyperliquid processed roughly $991 million in trading volume over the past 24 hours, according to data shared Wednesday on X by James Wang, director of product marketing at Cerebras Systems. Comparable contracts recorded about $75,000 in volume on Coinbase over the same period.

    The disparity underscores how liquidity for synthetic commodity exposure is clustering on crypto-native derivatives venues rather than traditional exchanges or U.S.-based crypto platforms.

    Order-book data in the oil market shows large resting orders and relatively tight spreads, suggesting participation from professional liquidity providers alongside retail traders.

    Crude prices surged on Monday amid fears the conflict could further disrupt shipments through the Strait of Hormuz, briefly pushing Brent crude to about $119.50 a barrel before retreating to roughly $91–$100 after President Donald Trump suggested the war involving Iran might soon de-escalate.

    By Wednesday evening in New York trading, Brent crude was hovering around $90–$92 a barrel as markets continued to digest developments and the prospect of emergency oil stockpile releases.

    The activity follows this month’s first weekend surge in trading on the exchange as tensions tied to Iran rattled global markets, helping to push the price of its native token, $HYPE, above $32. It is up a further 6% on the day to $36.33, according to CoinGecko data.

    As previously reported by Decrypt, traders have turned to the platform amid headlines surrounding tensions in the Middle East while conventional markets, at times, remain closed.

    Hyperliquid lets traders take leveraged positions through perpetual futures contracts collateralized by stablecoins, primarily USDC, allowing them to speculate without opening brokerage accounts or accessing regulated commodity futures venues such as the CME Group.

    The exchange’s system is divided between HyperCore and HyperEVM. HyperCore runs the platform fully on-chain, with spot and perpetual futures order books recording every order, trade, and liquidation with near-instant finality and supporting up to about 200,000 orders per second, according to its white paper. HyperEVM, meanwhile, provides an Ethereum-compatible environment where developers can deploy smart contracts and build applications that interact with the exchange’s liquidity.

    It’s a feature that has attracted participants since its mainnet launch in 2023, helping to ferment growth on the exchange while doubling the token’s total market cap to over $8.8 billion in one year.

    For Hyperliquid’s native token, $HYPE, trading tied to macro volatility can have direct financial implications. The protocol directs a portion of trading fees toward token buybacks, linking spikes in derivatives activity to potential demand for the asset.

    Analysts say geopolitical shocks may continue to drive episodic bursts of trading on always-on crypto venues as traders seek to position ahead of global events.

    If sustained, that dynamic could position platforms like Hyperliquid as an early outlet for traders seeking to price global risk ahead of conventional markets, they say.

  • Japan to tap oil reserves in historic move amid Middle East crisis

    Japan to tap oil reserves in historic move amid Middle East crisis

    Japan will begin releasing crude oil from its strategic reserves as early as next Monday to curb potential spikes in gasoline and petroleum prices caused by Middle East conflicts and disruptions to Persian Gulf oil shipments, Prime Minister Sanae Takaichi said Wednesday.

    The intervention will mark the first time the nation has tapped its government oil reserves without waiting for a coordinated response from the International Energy Agency (IEA) since stockpiling began in 1978.

    The release will cover 15 days’ worth of reserves held by private-sector entities, followed by one month’s supply from government stockpiles.

    “We will flexibly review the support measures to ensure continuous relief for the public even if the situation is prolonged,” Takaichi told reporters in Tokyo.

    Japan’s decision reflects its acute exposure to energy flows through the Strait of Hormuz, which has been effectively closed to commercial traffic following US and Israeli military strikes on Iran late last month.

    More than 90% of Japan’s crude imports originate from Persian Gulf producers, a dependency Takaichi characterized as “prominently high” relative to other industrialized economies.

    The prime minister warned that shipments are expected to drop dramatically by late March, creating the potential for severe shortages of gasoline and other refined products.

    Retail gasoline prices have already begun climbing. Industry ministry data show the national average approached 162 yen ($1.02) per liter as of Monday, up from a mid-January low of approximately 155 yen.

    Takaichi cited projections that prices could breach 200 yen ($1.26) per liter and pledged to deploy government funds to cap costs at roughly 170 yen, providing a buffer equivalent to approximately 15% below the anticipated peak.

    At the end of December, Japan held 470 million barrels of petroleum reserves, sufficient to cover 254 days of domestic consumption.

    Disclosure: This article was edited by Vivian Nguyen. For more information on how we create and review content, see our Editorial Policy.

  • MoonPay partners with Pump.fun to enable cross-chain crypto deposits

    MoonPay partners with Pump.fun to enable cross-chain crypto deposits

    MoonPay has partnered with Pump.fun to expand funding options for users on the Solana based meme token creation platform.

    Through the integration of MoonPay Deposits, Pump.fun users can fund their accounts using crypto from any wallet regardless of the token or blockchain used. MoonPay automatically handles swapping, bridging, and routing to deliver the final balance in the selected asset.

    The feature aims to remove one of the most common pain points in crypto trading: navigating multiple networks when transferring funds. Sending the wrong asset or choosing the wrong network can lead to failed transactions or lost funds. MoonPay Deposits manages compatibility and routing in a single flow to ensure funds arrive in the correct wallet and asset.

    Pump.fun traders can now fund their accounts using tokens from nine blockchains including Arbitrum, Base, Bitcoin, BNB Smart Chain, Ethereum, Hyperliquid, Plasma, Polygon, and Solana. Users can access the feature by selecting Deposit and then Cross Chain Deposit in the Pump.fun app.

    Our goal is to make it easier for people to move value quickly and securely across the crypto ecosystem so they can use it wherever they choose regardless of the network, said Ivan Soto-Wright, Founder and CEO of MoonPay.

    By supporting Pump.fun’s next phase of growth we are helping create a broader access point for users already participating in the ecosystem and those looking to join, Soto-Wright added.

    Pump.fun has surpassed 1.5 million downloads and has emerged as one of the fastest growing crypto platforms.

    We want to make the Pump.fun experience more versatile than ever, said Alon Cohen, cofounder of Pump.fun. Our users increasingly want to trade and hold more assets without ever leaving the app.

    The integration follows a recent platform upgrade that expanded support beyond Pump.fun native tokens to include assets from other launchpads as well as WBTC, PUMP, and USDC.

    Disclosure: This article was edited by Estefano Gomez. For more information on how we create and review content, see our Editorial Policy.

  • Bitcoin Price Pullback Tests Bulls — Bounce Attempt Incoming?

    Bitcoin Price Pullback Tests Bulls — Bounce Attempt Incoming?

    Bitcoin price started a recovery wave above the $68,500 zone. $BTC is now consolidating and might aim for more gains above $70,500.

    • Bitcoin started a decent recovery wave above the $69,200 zone.
    • The price is trading above $68,500 and the 100 hourly simple moving average.
    • There was a break below a bullish trend line with support at $70,400 on the hourly chart of the $BTC/USD pair (data feed from Kraken).
    • The pair might dip again if it trades below the $69,280 and $68,000 levels.

    Bitcoin Price Fails Near Resistance

    Bitcoin price remained elevated and extended its increase above the $68,500 level. $BTC climbed above the $69,200 and $70,000 resistance levels.

    The bulls pushed the price above the 61.8% Fib retracement level of the downward move from the $74,062 swing high to the $65,646 low. However, the bears are still active below $72,000. The price faced rejection near the $71,600 level and started a downside correction.

    There was a break below a bullish trend line with support at $70,400 on the hourly chart of the $BTC/USD pair. Bitcoin is now trading above $68,500 and the 100 hourly simple moving average. If the price remains stable above $68,500, it could attempt a fresh increase. Immediate resistance is near the $70,250 level.

    The first key resistance is near the $70,500 level. A close above the $70,500 resistance might send the price further higher. In the stated case, the price could rise and test the $71,500 resistance. Any more gains might send the price toward the $72,000 level or the 76.4% Fib retracement level of the downward move from the $74,062 swing high to the $65,646 low. The next barrier for the bulls could be $72,650.

    More Losses In $BTC?

    If Bitcoin fails to rise above the $70,500 resistance zone, it could start another decline. Immediate support is near the $69,280 level. The first major support is near the $68,500 level.

    The next support is now near the $68,000 zone. Any more losses might send the price toward the $67,250 support in the near term. The main support now sits at $66,500, below which $BTC might struggle to recover in the near term.

    Technical indicators:

    Hourly MACD – The MACD is now gaining pace in the bearish zone.

    Hourly RSI (Relative Strength Index) – The RSI for $BTC/USD is now near the 50 level.

    Major Support Levels – $68,500, followed by $68,000.

    Major Resistance Levels – $70,500 and $72,000.

  • HYPE Rallies 13% as Hyperliquid Sees Massive Spike in Oil and Silver Trading 

    HYPE Rallies 13% as Hyperliquid Sees Massive Spike in Oil and Silver Trading 

    • Hyperliquid coin price enters a consolidation range between two trendlines, offering dynamic resistance and support.
    • Hyperliquid recently recorded a weekend volume milestone close to $720 million.
    • The broader crypto market sentiment remains in extreme fear as the sentiment gauge, fear and greed index drops to 13%.

    $HYPE, the native token of decentralized perpetuals exchange, Hyperliquid recorded a significant spike of 13% on Monday, to reach $35.1 mark. The primary catalyst behind this surge followed a massive spike in Hyperliquid’s HIP-3 perpetual futures trading volume— associated with WTI crude amid geopolitical tension. Will the Hyperliquid price break the $40 region?

    Hyperliquid Benefits From Commodity Market Volatility

    On Monday, the Hyperliquid price outperformed a majority of major cryptocurrency with a roughly 13% surge, reaching its trading value of $34.5. Along with broader market uptick, $HYPE witnessed its 24-hours trading volume spike by 196% to $503 million, bolstering its on-chain activity.

    The most recent peak occurred on a weekend, when the tradexyz-driven activity boosted volumes to a new peak of about $720 million for non-trading days. This is after previous surges, with prices of silver shooting from $85 to $114 and back during the end of January triggering a surge in interest from retail buyers that saw volumes on weekdays rise to $4.67 billion and on weekends rise to $460 million on the platform.

    More recently, the US-Israel-Iran conflict, which began on a Saturday in late February, limited access to conventional crude oil futures. Traders flocked to Hyperliquid’s perpetual contracts for crude, sending weekend volumes of $630 million at the time. As the price of oil surged 80% in the next nine days, last weekend broke a new record at about $720 million.

    These episodes showcase how the platform captures demand for assets such as silver and oil in times of volatility or when traditional markets are closed, particularly among users who lack standard financial access. HIP-3 markets led by builders such as tradexyz, have made a significant contribution to overall volume growth, with tokenized traditional assets now making an interesting portion of activity. The resulting fee generation and use of the platform seem to be related to the latest movement for $HYPE in terms of price performance.

    $HYPE Enters Consolidation Trend Before Its Next Leap

    Over the past three months, the Hyperliquid price showcased a sideways trend below the $36.67 level amid broader market uncertainty. The daily chart highlighted that the consolidation resonated strictly within two rising trendlines, proving dynamic resistance and support to $HYPE price.

    The coin price bounced at least twice from each trendline suggests the lack of initiation from buyers to sellers to drive a sustainable move.

    With today’s price jump, the Hyperliquid coin managed to reclaim key EMAs (20, 50, 100, and 200) bolstering its position to challenge resistance trendline at $40. A potential breakout from this resistance would accelerate the market buying pressure and push $HYPE to its initial target at $50.

    On the contrary, if the supply pressure persists above $36.67 to $40 region, the Hyperliquid could revert lower and prolong its consolidation range. Amid a pessimistic approach, the coin price could breach the bottom trend near $30 and seeks support at $24 level.

  • Markets tread water as investors brace for inflation data

    Markets tread water as investors brace for inflation data

    The entire financial market spent Tuesday doing its best impression of a doctor’s waiting room. Everyone sat still, no one made eye contact, and the only real activity was nervous fidgeting over what comes next.

    US equities barely registered a pulse. The S&P 500 dipped 0.2%, oil prices couldn’t decide whether to surge or collapse, and crypto — somewhat surprisingly — caught a mild bid. Bitcoin edged past $70K, Ethereum held above $2K, and the broader digital asset market drifted higher even as traditional finance stayed frozen in place.

    What the numbers actually say

    Here’s the scorecard. Bitcoin gained 1.4% over 24 hours and 2.6% on the week, trading just above the $70K level that has become its psychological floor. Ethereum added a modest 1.0% on the day, holding comfortably above $2K. Solana ticked up 0.6%, trading near $86, and $XRP sat around $1.39.

    Those are not the kind of moves that make anyone rich overnight. But in context, they’re noteworthy.

    The crypto Fear and Greed Index, which measures market sentiment on a scale of 0 to 100, currently reads 15. That’s “Extreme Fear” — the kind of reading you typically see after a major crash or during prolonged uncertainty. Last week it was even lower, at 10.

    To put that in perspective, the index hit similar levels during the FTX collapse in November 2022 and the Terra/Luna implosion earlier that year. The fact that Bitcoin is trading near $70K while sentiment sits at crash-era lows is a disconnect worth paying attention to.

    In one oddly specific corner of the market, the top-performing crypto category over seven days was US Treasury-backed stablecoins, which surged 39.1%. In English: investors are parking money in the digital equivalent of government bonds. That’s not exactly a vote of confidence in risk-taking.

    Why everyone is staring at the CPI report

    The Consumer Price Index report is one of the most closely watched economic releases in the US. It measures how fast prices are rising for everyday goods and services — food, rent, gas, the stuff people actually buy.

    Why does it matter so much right now? Because the Federal Reserve uses inflation data to decide whether to cut, hold, or raise interest rates. And interest rate expectations drive virtually everything in both traditional and crypto markets.

    If CPI comes in hotter than expected, it signals inflation is stickier than hoped. That makes rate cuts less likely, which tends to hurt risk assets like stocks and crypto. The logic is straightforward: higher rates mean money is more expensive to borrow, which means less capital flowing into speculative investments.

    If CPI comes in cooler, the calculus flips. Lower inflation gives the Fed room to cut rates, which historically acts like rocket fuel for asset prices across the board. Bitcoin’s biggest rallies have often coincided with periods of monetary easing or the expectation of it.

    The market’s paralysis on Tuesday was essentially a collective refusal to place bets before seeing the data. Traders have been burned enough times by surprise inflation prints that they’d rather sit on their hands than guess wrong.

    Adding to the tension, geopolitical uncertainty continues to simmer. Oil prices have been swinging between record highs and sharp pullbacks, a pattern that typically injects volatility into inflation expectations. Higher oil means higher transportation and production costs, which can push CPI readings higher even if underlying demand is softening.

    What this means for crypto investors

    Here’s the thing about crypto trading at these levels during extreme fear: it creates an asymmetric setup. The sentiment is priced for disaster, but the actual price action hasn’t followed suit.

    Bitcoin holding above $70K while the Fear and Greed Index reads 15 suggests that the sellers who wanted out have mostly already left. The remaining holders are either long-term believers or institutions with mandates that don’t change based on weekly vibes. That kind of base can be surprisingly resilient.

    The risk, of course, is that a hot CPI print triggers a genuine selloff. If the report shows inflation reaccelerating, the market’s rate-cut hopes could evaporate quickly. Bitcoin has historically dropped 5-10% on hawkish surprises from the Fed or unexpectedly high inflation data. From $70K, that would mean a potential test of the $63K-$66K range.

    On the flip side, a cool print could be the catalyst that breaks the fear cycle. When sentiment is this depressed, even mildly positive news can trigger outsized moves higher. Markets that are positioned for the worst tend to rip when the worst doesn’t materialize.

    The Treasury-backed stablecoin trend is also worth monitoring as a leading indicator. When investors rotate heavily into yield-bearing stablecoins, it often signals they’re waiting on the sidelines with dry powder. That capital doesn’t disappear — it tends to redeploy when conditions shift. Think of it as a coiled spring rather than a permanent exit.

    Ethereum’s relative stability above $2K is another data point that matters for the broader ecosystem. ETH often acts as a bellwether for altcoin sentiment. If it holds this level through the CPI release, it could provide a floor for the rest of the market. If it breaks below, expect the pain to cascade through DeFi protocols and Layer 2 tokens.

    The competitive dynamic between chains also plays into this. Solana near $86 represents a significant discount from its highs, and its ecosystem activity has remained robust even as price action stagnated. $XRP at $1.39 continues to reflect the market’s ongoing recalibration of Ripple’s position following its partial legal victories.

    For investors trying to navigate this environment, the key question isn’t whether inflation will be high or low. It’s whether the market has already priced in the worst-case scenario. With a Fear and Greed reading of 15, the argument that bad news is largely baked in carries some weight — but it’s never a guarantee.

    Bottom line: The market is in a holding pattern, and the CPI report will likely break the stalemate one way or another. Crypto’s quiet climb during peak uncertainty and rock-bottom sentiment is either a sign of underlying strength or the calm before a storm. The data drops soon. Until then, everyone waits.

    Disclosure: This article was edited by Estefano Gomez. For more information on how we create and review content, see our Editorial Policy.

  • Bitcoin climbs to $71K as crude tumbles on possible global oil reserve release

    Bitcoin climbs to $71K as crude tumbles on possible global oil reserve release

    Bitcoin climbed nearly 5% on Tuesday, rising above $71K as risk assets rebounded amid signs that geopolitical tensions in the Middle East may be easing.

    The rally followed a sharp reversal in oil markets. Crude prices dropped more than 11% Tuesday, falling to around $83 after surging close to $120 a barrel on Monday following supply disruptions linked to the Iran conflict.

    The decline came after reports that the International Energy Agency will hold an emergency meeting of member countries Tuesday to discuss a potential coordinated release of strategic oil reserves to stabilize markets.

    As energy prices pulled back, investors rotated back into risk assets. Crypto markets moved higher across the board, with Bitcoin trading near $71.5K, while Ethereum rose to about $2,080 and Solana climbed to roughly $88, both gaining around 4%. XRP outperformed with a roughly 5% rise to about $1.43.

    Equities also advanced during the session. The S&P 500 gained about 0.4% while the Nasdaq Composite rose roughly 0.5%.

    Crypto related stocks joined the rally. Circle climbed about 7%, while Figure surged around 15%. Japan based Bitcoin treasury firm Metaplanet gained roughly 8%, and crypto mining company Bitfarms rose about 7%.

    Disclosure: This article was edited by Estefano Gomez. For more information on how we create and review content, see our Editorial Policy.

  • Circle could rally 60% more on stablecoin adoption, AI agentic finance, Bernstein says

    Circle could rally 60% more on stablecoin adoption, AI agentic finance, Bernstein says

    Shares of Circle (CRCL), the crypto firm behind the $USDC ($USDC) stablecoin, could add to their recent remarkable surge, according to analysts at brokerage Bernstein.

    The team, led by Gautam Chhugani, rate the stock at outperform with a $190 price target, suggesting about 60% upside from current $120 level. And that’s after the stock rallied more than 100% in the past few weeks following an earnings beat, which likely triggered a short squeeze.

    Bernstein’s thesis centers on stablecoin adoption increasingly diverging from the broader crypto market.

    Circle’s $USDC supply briefly fell after the October liquidity shock in crypto markets but has since rebounded to just shy of its record $78 billion, even as bitcoin BTC$70,816.15 and the broader crypto markets remain well below its highs. The total market for U.S. dollar-backed stablecoins also remained steady at around $270 billion despite the crypto bear market, the report noted.

    Transaction activity is accelerating as well, the report noted. Adjusted stablecoin volumes grew more than 90% year-over-year, while transaction velocity — a measure of how frequently tokens change hands — has increased, suggesting stablecoins are increasingly used beyond crypto trading.

    Payments adoption is a key driver behind that, Bernstein said, as stablecoins are increasingly getting embedded with traditional card networks, enabling everyday transactions. Visa (V), for example, now supports more than 130 such stablecoin-linked cards across 50 countries, processing roughly $4.6 billion in annualized settlement volume, the report noted.

    Circle is also expanding its Circle Payments Network, which allows institutions to send $USDC cross-border and convert it into local currencies through banking partners. The network now includes about 55 institutions, with annualized volumes reaching $5.7 billion earlier this year, the report said.

    Looking ahead, Bernstein also highlighted a potential new growth theme: AI-driven “agentic finance.” As autonomous software agents increasingly transact online, stablecoins could become a natural payment rail for micropayments between machines, such as for API calls or automated services.

    To support that vision, Circle is building a high-throughput, payments-focused blockchain called Arc, designed for fast, low-cost transactions.

    Read more: Why Circle and Stripe (And Many Others) Are Launching Their Own Blockchains

  • Bank of America Analysts: “If Oil Prices Continue to Remain High, the FED May Be Forced to Cut Interest Rates”

    Bank of America Analysts: “If Oil Prices Continue to Remain High, the FED May Be Forced to Cut Interest Rates”

    In its latest report, Bank of America stated that persistent shocks in oil prices could pave the way for the Federal Reserve to ease its monetary policy. According to the bank, while markets largely view rising oil prices as a threat to inflation, supply shocks pose risks to both sides of the Fed’s dual mandate.

    The report states that monetary policy generally tightens during periods of strong consumer demand and when economic activity is able to withstand supply shocks. This could allow the Fed to prioritize fighting inflation, as it did in 2022 during the Russia-Ukraine war.

    However, Bank of America noted that current economic conditions are quite different compared to that period. In 2022, the unemployment rate in the US economy hovered around 4 percent, core PCE inflation was above 5 percent, and non-farm employment was growing by approximately 500,000 per month. Furthermore, consumers had accumulated a significant amount of fiscal stimulus from the pandemic period.

    Today, employment growth is slower, inflation is relatively high, and fiscal stimulus is more limited. The bank believes that continued shocks in oil prices could put pressure on economic growth and create conditions for the Fed to adopt a more supportive, or looser, monetary policy.

    *This is not investment advice.