Tag: CRYPTOS FoxBusiness.

  • Banks risk another 2008 crisis after moving the equivalent of 18 million BTC into shadow lenders

    US banks “reduced” their credit risk after 2008 by shifting more of it to nonbank lenders.

    Since 2008, banks have shifted a growing share of their lending to nonbanks like private credit funds, making it their fastest-growing loan category.

    That shift doesn’t signal another 2008-style crisis today, but it does show where trouble could surface first if private credit starts to crack.

    This week, traders, analysts, and Investment firms are reviving a familiar question: are US banks setting up a repeat of 2008?

    The clean answer is no, based on the publicly available numbers. The same debate also points to a real shift in bank balance sheets that deserves a harder look.

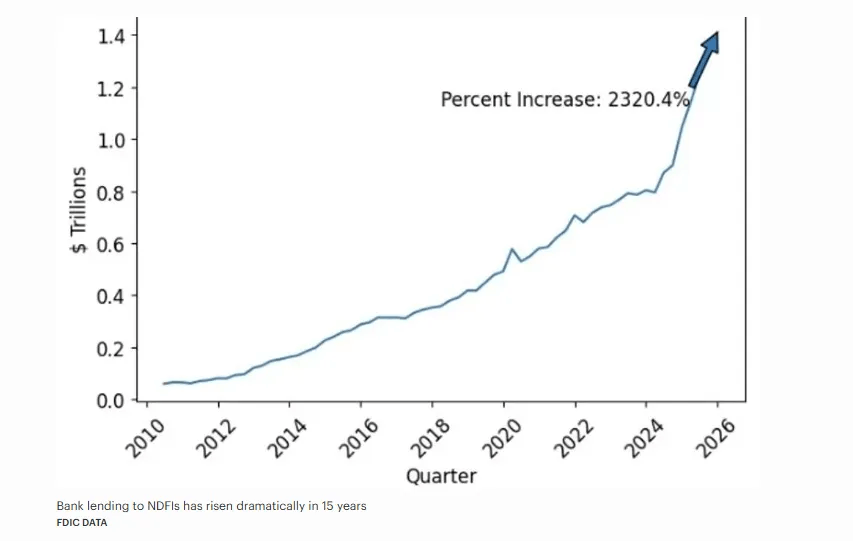
    The chart below, which is circulating on X, shows that bank lending to nondepository financial institutions, or NDFIs, rose 2,320% over 15 years.

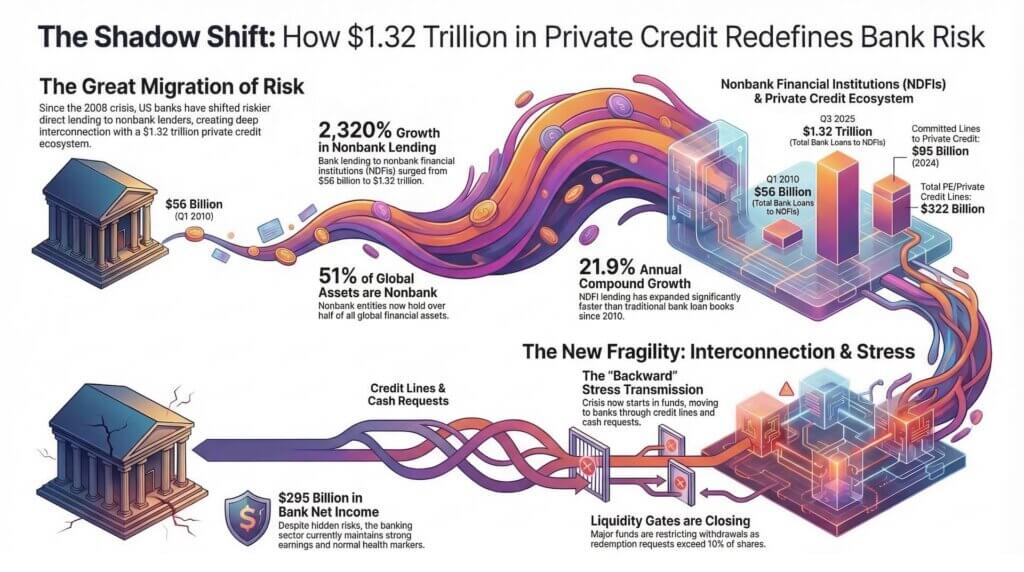
    An FDIC note documented $1.32 trillion of those loans by the third quarter of 2025, up from $56 billion in the first quarter of 2010, and called the category the fastest-growing loan segment since the 2008-09 crisis.

    After 2008, large banks pulled back from riskier direct lending, but they also funded the nonbank lenders that stepped in. That group includes private credit vehicles, mortgage finance firms, securitization structures, and other parts of the shadow banking system. The risk moved elsewhere rather than disappearing.

    However, that does not mean banks are already in trouble. The FDIC’s latest industry profile showed the banking sector earned $295 billion in 2025, posted a fourth-quarter return on assets of 1.24%, reduced unrealized securities losses to $306 billion, and counted 60 problem banks, still within the agency’s normal non-crisis range. Those are not the numbers of a system already in a panic.

    The issue is where losses, redemptions, and liquidity pressure land when the lending chain has more links.

    For crypto, that changes the timing of any stress. A classic bank panic starts at the bank. In the current structure, stress can begin in a fund, a warehouse line, or a financing vehicle, then work backward into banks if marks fall, borrowers miss payments, or investors ask for cash faster than the assets can be sold.

    The post-crisis shift is now visible in the numbers

    The official numbers make the structural change hard to dismiss. The FDIC said bank lending to NDFIs compounded at 21.9% a year from 2010 to 2024.

    By the third quarter of 2025, the total had reached $1.32 trillion, or roughly 10% of bank lending in the agency’s analysis.

    Not every dollar in that bucket is private credit, and exposures in the category carry different levels of risk. Even so, the scale shows that a large share of credit intermediation now sits in institutions that do not take deposits and often disclose less than banks do.

    That nuance is important. NDFI is a broad label. It can include mortgage intermediaries, consumer finance firms, securitization vehicles, private equity funds, and other nonbank lenders, alongside private-credit funds.

    A sloppy reading turns the whole bucket into one bet on private credit. A more accurate reading is that banks built a large, fast-growing set of links to the broader nonbank system.

    Private credit is one visible part of that system, and one of the most closely watched because it grew during a long period of higher rates, tighter bank regulation, and steady investor demand for yield.

    A Federal Reserve staff note sharpens this point. It is estimated that committed credit lines from the largest US banks to private-credit vehicles rose from about $8 billion in the first quarter of 2013 to about $95 billion by the fourth quarter of 2024, with roughly $56 billion already drawn.

    The same work put total committed bank lines to private credit and private equity at about $322 billion.

    That does not prove systemic failure is close. The Fed’s own conclusion was more restrained: direct financial-stability risk from this channel looked limited so far because the largest banks appeared able to absorb major drawdowns.

    Even so, growing links between banks and private-credit vehicles warrant close attention.

    The risk is best framed as continued bank funding for parts of the lending chain, which changes where stress appears first.

    In the public market, losses print quickly. In private markets, they can move more slowly because marks update less often, assets are less liquid, and investor withdrawals are managed through product rules.

    That delay can make the system look calm until cash needs force a sharper repricing.

    Global context points in the same direction. The Financial Stability Board said the nonbank financial intermediation sector accounted for about 51% of total global financial assets in 2024 and continued to grow at roughly twice the pace of banking, according to its latest report.

    This is no longer a US edge case. Credit has been moving into institutions outside the classic banking model for years, and the US private-credit boom is part of that wider pattern.

    Why the trade is getting tested now

    The issue became more urgent as structural data arrived while private credit began to show public strain. Some private-credit vehicles have limited or managed withdrawals, while JPMorgan tightened some lending against private-credit portfolios after markdowns.

    Those events stop short of establishing a full-market break and instead show where pressure is likely to emerge first: fund liquidity, financing terms, and collateral values.

    That is also why any comparison to 2008 needs restraint.

    The same FDIC report that drove renewed attention also showed banks entering this phase from a stronger income position than during past crises. The public banking system is not in free fall.

    The greater concern is a funding architecture that could transmit stress from nonbank lenders back into banks if private assets keep repricing lower or if investors want cash before loans can be sold or refinanced.

    Borrower quality and refinancing deserve more attention than broad slogans. In a recent Financial Times interview, Partners Group’s chair said that private-credit default rates could double from their roughly 2.6% historical average over the coming years. That is not an official baseline, and it should not be treated as one.

    It does, however, capture the key pressure point. A system built on long-duration private loans, slower marks, and regular financing lines can look stable until defaults rise and refinancing windows narrow at the same time.

    For Bitcoin, the setup is awkward in the short run and cleaner in the medium run. At the time of writing, $BTC traded near $73,777 and held 58.5% market dominance, with gains of 0.05% over 24 hours, 4.55% over seven days, and 7.51% over 30 days, according to CryptoSlate data.

    That price action suggests crypto is not trading as if a banking event is already underway. If a broader credit squeeze did hit, the first move would likely be a selloff in liquid assets, and Bitcoin is still one of the most liquid assets in global markets.

    Over a longer horizon, if the debate broadens into a deeper loss of trust in how the financial system carries leverage and values private assets, Bitcoin’s appeal as an asset outside the banking stack becomes easier to articulate.

    That second-order effect is the real contagion risk for crypto.

    A private-credit strain does not automatically send capital into Bitcoin on day one. It can easily produce the opposite move.

    Over time, though, if banks have to pull back, if fund financing gets harder, and if more investors start asking who really owns the credit risk, the case for holding some assets outside that system becomes easier to make. We know that trade. The banking data now place it in a new macro setting.

    What to watch in the next round of data

    The next phase of this story will likely emerge through three checks: whether more private-credit vehicles limit withdrawals or take larger marks, whether banks keep financing those funds on the same terms, and whether the NDFI loan book continues to expand at anything close to the pace the FDIC documented over the prior decade.

    That is where the current debate becomes more concrete than the usual “shadow banking” label. If banks tighten financing to nonbank lenders, middle-market borrowers can feel it quickly through cost and access, even if no household hears the acronym NDFI.

    If the funds meet redemptions by selling what they can, public credit can take some of the price discovery that private books avoided. If the funds do not sell and banks keep financing them, the exposure stays in the system longer.

    None of those paths requires a repeat of 2008. All of them can still change how credit flows.

    Pressure is already showing in all three areas

    The direction of travel so far looks like tightening, not collapse.

    On withdrawals and marks, semi-liquid private-credit vehicles are restricting cash more aggressively while investors push for fresher valuations.

    A recent report said Cliffwater’s flagship corporate lending fund received redemption requests equal to about 14% of shares and met only 7%, while Morgan Stanley’s North Haven fund received requests equal to 10.9% and honored only its 5% cap.

    The same report said BlackRock and other vehicles also hit standard quarterly limits, while Apollo moved toward monthly and then daily NAV reporting to answer criticism of stale pricing.

    That points to weaker liquidity conditions and stronger investor demand for faster price discovery and greater cash access at the same time.

    On bank financing, lenders are getting more selective rather than shutting the door outright.

    A separate report said JPMorgan marked down some software-backed private-credit collateral and restricted lending to affected funds, which reduced borrowing capacity and pointed to tougher collateral treatment in weaker pockets of the market.

    That stance is not universal. Other coverage said banks were still willing to finance some withdrawal needs. The signal is narrower and more useful: lenders are still in the market, but they are showing less tolerance for weak collateral and more willingness to tighten terms fund by fund.

    On balance-sheet growth, the NDFI loan book has already changed behavior without needing to contract outright.

    The FDIC’s February 2026 study said bank loans to NDFIs compounded at 21.9% annually from 2010 to 2024 and reached $1.32 trillion by the third quarter of 2025. A category that grew at that pace does not need an outright contraction to reset underwriting.

    Slower growth, more frequent markdowns, and tougher financing terms are enough to change redemption behavior, reduce leverage, and make investors less willing to assume that rapid balance-sheet growth can continue alongside benign losses.

    The official numbers argue against panic today, but they do not support complacency.

    The FDIC’s balance-sheet data show a large post-crisis migration in bank exposures. The Fed’s research shows large banks remain connected to the private-credit complex through financing lines. Global data show nonbank finance has become too large to treat as a side story, and the first public tests of private-credit liquidity are already showing up in the market.

    The next stress point may arrive through a route that looks safer in good times because it sits one step away from the bank.

    The next useful check is whether fund withdrawals stay contained, whether bank financing stays open, and whether the $1.32 trillion exposure that the FDIC documented keeps rising as private credit faces a harder year.

  • Senator Lummis Announced Good News Regarding the Clarity Act, a Highly Critical Cryptocurrency Bill

    Senator Lummis Announced Good News Regarding the Clarity Act, a Highly Critical Cryptocurrency Bill

    As comprehensive regulatory efforts targeting the cryptocurrency market in the US gain momentum, Senator Cynthia Lummis made important statements. Lummis, the architect of the “Bitcoin Strategic Reserve Act” bill, stated that this critical legislation, known publicly as the CLARITY Act, will be finalized by the end of the year.

    Speaking at the DC Blockchain Summit in Washington D.C., Lummis stated that the Senate Banking Committee will consider the bill in the second half of April, following the Easter break. The committee is expected to make changes to the bill before submitting it for a vote. Lummis clarified the timeline, saying, “In April, after the Easter break, we will markup the bill.”

    This regulation is critical to establishing the legal framework for the cryptocurrency market in the US. The bill aims to clarify the boundaries of authority between the CFTC and the SEC, define the conditions under which digital assets are considered securities or commodities, and introduce new transparency obligations.

    Last year, the House of Representatives passed a similar bill, the CLARITY Act, with bipartisan support. However, the process was more difficult in the Senate. In January, the Senate Agriculture Committee passed its version with only Republican votes, while the Democrats did not support the bill.

    On the other hand, the critical hearing that the Senate Banking Committee had planned to hold in January was canceled at the last minute after cryptocurrency exchange Coinbase withdrew its support.

    *This is not investment advice.

  • Attention: The 13-Year-Old Ancient Whale Who Bought Bitcoin (BTC) for Only $332 Has Made a Move! Here’s the Huge Profit It Made!

    An “ancient whale” who bought 5,000 $BTC in November 2013 when Bitcoin was only $332, has started selling Bitcoin ($BTC) almost 13 years later.

    According to onchain data released by the cryptocurrency platform Lookonchain, this whale first started selling Bitcoin in November 2024.

    The whale, which awoke from its slumber in November 2024, has so far transferred 3,500 $BTC to Binance at an average price of $94,786. And it has made a significant profit of approximately $330 million from these $BTC sales.

    According to Arkham Intelligence data, this ancient whale also sold another 1,000 $BTC about seven hours ago, earning approximately $71.57 million.

    The balance of 1,500 $BTC, worth approximately $106 million at current prices, is still in the whale’s wallet.

    Bitcoin is currently trading around $70,840 after experiencing a 4.8% drop in the last 24 hours.

    A #BitcoinOG with 5K $BTC($356M) sold another 1,000 $BTC($71.57M) 8 hours ago.

    This OG received 5K $BTC(cost $1.66M) at $332 12 years ago, and started selling $BTC on Nov 26, 2024, selling a total of 3,500 $BTC($337M) at ~$96,262.

    Total profit: $442M — a 266x return.… pic.twitter.com/oErv0KccjN

    — Lookonchain (@lookonchain) March 19, 2026

    *This is not investment advice.

  • Crypto Market Review: Bitcoin (BTC) Not Giving up on $80,000, Ethereum (ETH) Has Golden Cross Potential, Is XRP at Risk of Losing $1.50 for Good?

    Crypto Market Review: Bitcoin (BTC) Not Giving up on $80,000, Ethereum (ETH) Has Golden Cross Potential, Is XRP at Risk of Losing $1.50 for Good?

    As the asset struggles to sustain momentum above the $1.50 mark, $XRP is once again nearing a turning point in its current market cycle. The wider technical structure indicates that this support zone may soon be lost, possibly forcing the asset into a longer period of consolidation below this threshold, despite the price’s recent attempt at a modest rebound.

    Lack of conviction around $XRP

    $XRP has been stuck in a steady decline over the last few months, marked by lower highs and waning momentum. The dominance of sellers on the market has been reinforced by key moving averages that have capped every recovery attempt.

    Although buyers have recently succeeded in raising the price from local lows close to the $1.30 area, the recovery is still precarious and technically unfinished.

    Article image

    The $1.50 level, which has served as a short-term pivot point during recent trading sessions, is at the center of the current struggle. The price has not developed significant momentum above this zone, even though the market briefly reclaimed it.

    The absence of consistent buying pressure raises the possibility that the market is not yet prepared to restore this level as solid support.

    $XRP may soon test, and possibly lose, the 50 EMA once more if it is unable to sustain its recent recovery structure. The short-term outlook would be seriously weakened by such a development.

    A verified rejection at the 50 EMA would probably strengthen the general negative trend and raise the likelihood that $XRP will fall below $1.50 once more. If this occurs, the level may move from short-term support into a far-off resistance zone that might take some time to recover.

    Technically speaking, losing $1.50 would represent a significant structural and psychological setback. Long-term consolidation is frequently necessary for markets to recover lost levels, especially when broader trend indicators are still negative.

    Ethereum’s potential

    A potential golden cross between the 26-day and 50-day exponential moving averages (EMAs) is a significant technical event that traders frequently keep a close eye on for Ethereum (ETH). Even though there has been persistent bearish pressure on the market for a number of months, recent price action indicates that momentum may be gradually changing.

    Ethereum has recently started to form a recovery structure following a steep decline earlier this year that drove the price below several significant support levels. The asset is currently trading in the $2,200-$2,300 range after rising from lows close to the $2,000 area. Shorter-term moving averages have begun to converge as a result of this rebound, raising the prospect of a technical crossover.

    Article image

    When a shorter-term moving average crosses above a longer-term one, it is known as a golden cross and indicates that recent price momentum is strengthening in relation to the overall trend. The 26-day EMA for Ethereum is rising and getting closer to the 50-day EMA, which has been serving as dynamic resistance during the current decline.

    A change in short-term momentum, and the possibility that buyers are taking back control of the market, would be indicated if the 26 EMA were to successfully cross above the 50 EMA. Technical traders frequently take notice of such a crossover because it implies that recent price increases are significant enough to change the market’s trend structure.

    A sustained rally is not, however, assured by a golden cross alone. Above the current price, Ethereum still faces a number of significant resistance levels. Higher moving averages, such as the 100-day and 200-day EMAs — which are still sloping downward and reflect the general bearish trend that has dominated the market in recent months — are still below the asset.

    Ethereum would probably need to sustain its upward momentum and recover adjacent resistance zones in order for the potential golden cross to have a significant effect. Confirming that the crossover represents true market strength rather than a transient bounce would require strong volume and ongoing buying pressure.

    Bitcoin loses momentum

    As the market steadies following a steep decline earlier this year, Bitcoin is once again trying to regain momentum. Recent price action indicates that Bitcoin is not giving up on its attempt to return to the $80,000 range, even though the overall trend is still cautious.

    The asset is currently constructing a short-term recovery structure that maintains the potential to test higher resistance levels after demonstrating resilience close to its recent lows.

    Bitcoin saw a large sell-off that drove the price down toward the $65,000-$70,000 range after declining from levels above $95,000 during the previous cycle phase. Buyers started to intervene after that decline created a brief bottom, slowing the downward trend and laying the groundwork for a possible recovery.

    $70,000 is a magnet

    Bitcoin has been steadily returning to the mid-$70,000 range in recent sessions. Improved short-term momentum and a series of higher lows that point to increasing buying pressure have helped to support this recovery.

    According to the current structure, traders are trying to regain their confidence following the previous decline.

    The next significant technical and psychological turning point is currently the $80,000 level. In addition to potentially reopening the path toward higher price zones seen earlier in the cycle, regaining that level would be a significant step toward regaining bullish momentum.

    Bitcoin has a number of challenges to overcome: the asset stays below important moving averages, such as medium-term trend indicators that frequently serve as resistance during recovery phases, that are still sloping downward. If buying pressure wanes, these levels might slow the current rally.

  • XRP Price Projections Soar To $15-$30 On CLARITY Act Prospects And Bank Adoption

    The $XRP price slid 5% on Wednesday as a wider market pullback dragged most major tokens lower, knocking the altcoin back to roughly $1.43. Experts point to the same recurring forces behind the swing: persistent geopolitical tensions in the Middle East and a shortage of fresh, bullish catalysts.

    Despite the near-term weakness, market observers remain upbeat about $XRP’s longer-term prospects, centering their optimism on an anticipated policy development in Washington.

    Potential Surge In Adoption And ETF Inflows

    Industry analysts widely believe that passage of the CLARITY Act — the proposed crypto market-structure bill in the US Congress — would materially improve $XRP’s institutional outlook by formally classifying the token as a digital commodity.

    That legal status would place $XRP on a regulatory footing similar to Bitcoin (BTC) and Ethereum (ETH) and, according to proponents, remove a major barrier to large-scale adoption by banks, asset managers, and payment providers.

    BINANCE:XRPUSDT Chart Image by ronaldomarquez998

    In a new analysis, Sam Daodu of 24/7 Wall St. argued that the CLARITY Act is the single most important catalyst that could propel the $XRP price past key resistance levels.

    He noted that commodity designation would allow US banks to use $XRP for cross-border settlement via Ripple’s payment rails without the looming uncertainty that a regulatory reclassification might later introduce.

    That legal clarity, Daodu said, would unlock institutional confidence and encourage sizeable inflows into $XRP investment products such as exchange-traded funds (ETFs).

    $XRP Price Targets Lifted

    Daodu also cited forecasts from Standard Chartered’s Geoffrey Kendrick, who previously set an $8 target for $XRP in 2026, premised on the passage of the CLARITY Act. Kendrick’s model anticipates $4 billion to $8 billion in cumulative ETF inflows by year-end if the bill passes.

    Consensus among many analysts places the $XRP price between $5 and $10 should the legislation clear Congress, with an $8 price implying a market capitalization near $490 billion — a level Daodu argues is plausible if banks adopt $XRP for actual payment use rather than the token remaining a retail trading vehicle.

    Daodu went further in outlining further upside scenarios: if the CLARITY Act were approved and Ripple’s application for a master account at the Federal Reserve were also successful by late 2026, some models project $XRP could trade in a $15–$30 range under full bank adoption.

    The CLARITY Act passed the House in July 2025 by a 294–134 vote and moved through the Senate Agriculture Committee on January 29. However, the Senate Banking Committee has yet to schedule a new markup since January, and negotiators have not published a reconciled draft that satisfies both crypto and banking stakeholders.

    However, on Wednesday, pro-crypto Senator Cynthia Lummis indicated renewed momentum when she said that the Banking Committee plans to mark up the bill in April, following the Easter recess.

    Featured image from DALL-E, chart from TradingView.com

  • Bitcoin Exchange Bithumb Announces Listing of This Altcoin on its Spot Trading Platform! Here Are the Details

    Bitcoin Exchange Bithumb Announces Listing of This Altcoin on its Spot Trading Platform! Here Are the Details

    South Korea-based cryptocurrency exchange Bithumb is preparing to add another digital asset to its platform. According to the announcement from the exchange, the Fabric Protocol ($ROBO) token will be listed with a trading pair against the Korean won (KRW).

    According to the announcement, deposit and withdrawal operations for the $ROBO token will open within one hour of the announcement’s publication. The scheduled start date for transactions is March 18, 2026, at 2 PM. The initial listing price of the token is set at 44.90 won, and the required number of confirmations for deposits is 33.

    Fabric Protocol stands out as a decentralized infrastructure project aiming to bring together robotic systems and artificial intelligence applications. Through an open-source runtime environment called OM1, the project enables the same AI agents to run on both physical robots and web-based systems. This system is designed to be compatible with different types of hardware, including quadruped robots, wheeled devices, and humanoid robots.

    The $ROBO token has various use cases within the ecosystem. It will be used by network operators as staking collateral, a payment method for data trading and computational tasks, and in governance mechanisms and reward distribution.

    Bithumb also highlighted the trading restrictions applicable to newly listed assets. Accordingly, buy orders will be limited for the first 5 minutes after trading begins. Furthermore, sell orders that are more than 10% below or 100% above the designated reference price will not be allowed within the first 5 minutes. Only limit orders will be accepted for the first two hours.

    The exchange warned investors that crypto assets involve high risks and emphasized the need for thorough research before making any transactions.

    *This is not investment advice.

  • Extraordinary Data Revealed for XRP! Seen for the First Time in XRP History!

    Cryptocurrency analytics company Santiment has announced that the $XRP Ledger has recently shown significant growth signals. According to the company’s data, interest in $XRP is rapidly increasing, both in terms of usage and among key users.

    Santiment reported that the number of addresses holding $XRP reached a record high of 7.7 million, and the number of daily active addresses also rose to its highest level in five weeks.

    According to Santiment data, the number of daily active addresses on the $XRP Ledger (XRPL) rose to 46,767, its highest level in five weeks. This increase in network activity coincided with the $XRP price reaching a four-week high of $1.60.

    At the same time, the number of non-empty addresses in XRPL reached 7.7 million for the first time.

    “With its usage continuing to grow, the $XRP Ledger has reached over 7.7 million holders (non-empty wallets) for the first time in its more than 13-year history.”

    In addition, the daily number of active addresses closed at 46,767, the highest level in 5 weeks.

    This means that $XRP usage continues to increase even during periods of market downturns.

    *This is not investment advice.

  • XRP hovers near $14 million options battleground that could sway trading

    XRP hovers near $14 million options battleground that could sway trading

    $XRP ($XRP) is trading just above a level heavily targeted by derivative traders, making it a critical zone for near-term price action.

    The payments-focused cryptocurrency changed hands at around $1.50 at press time, placing just above a notable concentration of options activity at $1.40 on crypto exchange Deribit. $XRP is used by Ripple to facilitate cross-border transactions.

    Options are derivatives contracts whose value is derived from an underlying asset, in this case $XRP. They give traders the right, but not the obligation, to buy or sell $XRP at a specific price (known as the strike) before a set expiry date. Call options are typically used to bet on upside, while put options are used to hedge or speculate on downside.

    As of writing, about $6.95 million worth of call option positions were open at the $1.40 strike, alongside $7.69 million in put positions at the same level. In total, that brings the value of outstanding or “open” contracts at this strike to roughly $14.6 million, or nearly 25% of all $XRP options open on the exchange. Most of this open interest in concentrated in the March 27 expiry.

    CoinDesk reached out to Deribit for a comment on the same.

    This kind of clustering at a single strike is unusual and typically signals that the market is approaching a key inflection point.

    $XRP options: Distribution of open interest. (Deribit Metrics)

    As expiry approaches, this level may act as a magnet or gravitational price zone. Market makers, and traders who sold options at $1.40 and are “short gamma” could dynamically hedge their exposure, potentially pulling the price toward the strike. This phenomenon is widely referred to as “pinning.”

    This concept is common in currency markets, where major currency pairs like EUR/USD often gravitate toward large strikes as expiry nears.

    Traders, therefore, need to watch $1.40 level closely in the days ahead. A sustained move above it could leave much of the put-side open interest to expire worthless, while a drop below it could trigger hedging flows that amplify selling pressure.

    Either way, the heavy concentration of options at this strike suggests that $XRP’s short-term price action could be heavily influenced by how this open interest unwinds or gets settled.