Hyperliquid’s native token, $HYPE, has been included in the portfolio of a US-based crypto index ETF for the first time. Added to Hashdex’s Nasdaq Crypto Index US ETF (NCIQ), $HYPE now holds a 3.4% weighting, making it the fifth largest asset in the ETF.
According to the latest index composition released by Hashdex, Bitcoin ($BTC) constitutes the largest portion of the portfolio with 74.6%. The fact that Bitcoin’s previous weighting was around 78% indicates that the share of $BTC has been reduced with the recent adjustment.
Ethereum (ETH) ranks second with 11.8%, while XRP has a weighting of 5.1%. Solana’s (SOL) share increased from 3.2% to 3.7%. $HYPE, with a weighting of 3.4%, is the fifth largest component of the ETF portfolio, right behind Solana.
$HYPE’s inclusion in NCIQ is considered a significant development for the token, particularly in terms of access to regulated investment products, especially those based in the US.
$HYPE is known as the native token of the decentralized cryptocurrency exchange Hyperliquid.
The delay is another sign of the cooling market for crypto IPOs after the industry entered 2026 expecting a wave of public listings following the successful debuts of Circle CRCL$88.88·At close and CoinDesk’s owner Bullish BLSH$32.64·At close last year. Weaker crypto prices and trading volumes, coupled with poor aftermarket performance from some newly listed digital-asset companies, have dampened investor appetite and prompted several high-profile firms, including asset manager Grayscale, Ethereum software developer Consensys and hardware wallet maker Ledger, to postpone their plans.
Payward confidentially filed a draft S-1 registration statement with the U.S. Securities and Exchange Commission (SEC) in November 2025 for a proposed offering of its common stock.
The filing came shortly after the company raised $800 million from investors at a $20 billion valuation, including a $200 million investment from Citadel Securities.
Since shelving the IPO, Payward has continued to expand beyond its core crypto exchange business, adding traditional and crypto derivatives, tokenized equities and payments infrastructure through a series of acquisitions and product launches.
The company reported adjusted revenue of $508 million for the second quarter, up 17% from a year earlier, while funded accounts rose 42% to 6.6 million. Assets on the platform stood at $40 billion.
The $ICP price is approaching a key technical level as recent UNDP-DFINITY developments coincide with stronger whale accumulation and rising network activity. The partnership introduces sovereign cloud and agentic AI pilots for public services, while OpenSaaS expands the ecosystem’s business software offering. These developments have also accompanied notable changes in $ICP holder behavior.
UNDP and DFINITY Expand Public-Service Plans
On August 25, the UN Development Programme and DFINITY Foundation announced an agreement focused on bringing sovereign cloud and agentic AI capabilities to public services. The UNDP operates across more than 170 countries and has supported digital public infrastructure initiatives in more than 25 countries.
Over the next 12 months, DFINITY plans to pilot the technology through UNDP Country Offices and civil society organizations while working with governments through co-design pilots. The initiative will run on Cloud Engines, with OpenSaaS software available alongside tools that include Caffeine, Claude Code, Codex and Perplexity.
Two days later, DFINITY introduced OpenSaaS as a business software suite designed without per-seat fees. The platform is described as free forever, remixable and capable of allowing users to modify applications through AI instructions. It also emphasizes software ownership, data control and operation through Cloud Engines.
$ICP Holder Accumulation Strengthens
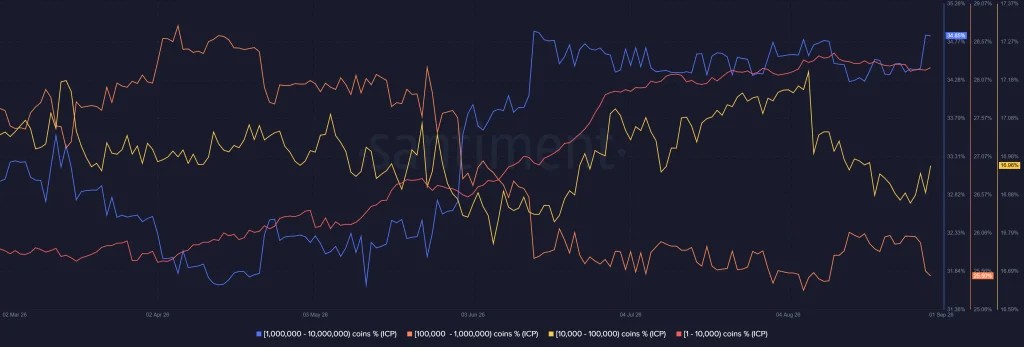
Meanwhile, on-chain distribution data points to changing investor behavior. The 1K-10K $ICP cohort has generally increased since early 2026, while the 10K-100K cohort had previously declined before showing a notable accumulation spike in late August.
At the same time, the 100K-1M $ICP cohort has continued to decline since early 2026. However, large holders in the 1M-10M $ICP range have continued accumulating, with another increase visible toward late August. While the timing coincides with the recent announcements, the data alone does not establish that the partnership news directly caused the accumulation but timeline of the activity still matters.
$ICP Price Targets $3.10 and $4.10
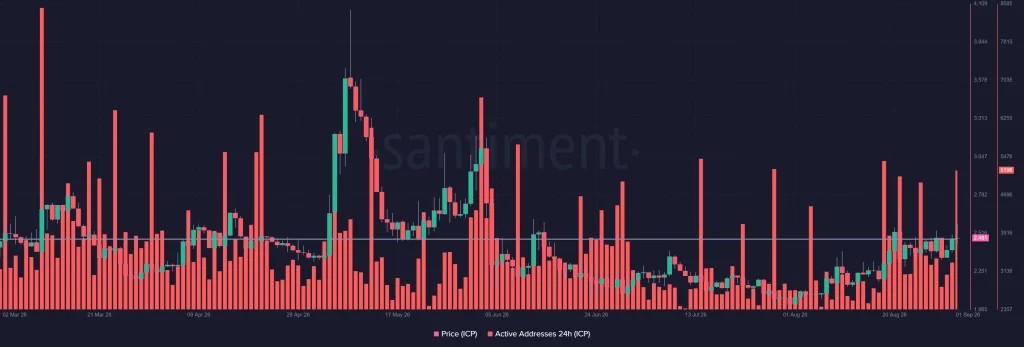
Network activity is also showing signs of improvement, with 24-hour active addresses recording a spike. Consequently, the $ICP price is approaching a decision point around the $2.48 resistance level.
If demand strengthens enough to break above $2.48, the next potential levels highlighted by the current setup are $3.10 and $4.10. Conversely, continued selling pressure could push the $ICP price below the resistance zone, bringing $2.00 and potentially $1.00 into focus.
Bitcoin’s nearly 40% rise from its lows in late June has reignited debates about whether a new bull cycle has begun in the cryptocurrency market.
Frontier-tech investor Didier and macro hedge fund portfolio manager Griffin Ardern discussed Bitcoin’s recent recovery and how the market might shape up going forward. While the two largely agreed on the dynamics behind the current rally, they offered differing opinions on whether Bitcoin has entered a new bull market.
Didier considers Bitcoin’s significant break above its 200-day moving average a major technical signal. He notes that the relatively low market positioning and the high volume of short positions could also support the rise, suggesting that the current movement could indicate the early stages of a new bull market.
Griffin Ardern, however, takes a more cautious approach. According to Ardern, Bitcoin is still in the final stages of a prolonged bear cycle, and clearer signals from dollar liquidity, US fiscal policy, and the Treasury bond market are needed before a sustained bull market can be discussed.
Both market experts agree that the recent rise in Bitcoin was not solely due to fundamental factors. They cite several key reasons for the price movement, including investors not having taken sufficient positions in the market before the rise, the closing of short positions, and changes in expectations regarding the US fiscal outlook.
However, Didier and Ardern differ on the trajectory of US Treasury bond yields and the outlook for global liquidity. In particular, developments in the bond market are noted as potentially decisive in terms of the size of capital flowing into risky assets.
The assessments also examined the balance sheet structure and Bitcoin position of Strategy, led by Michael Saylor. In addition, the possibility of capital flowing from the increasingly crowded AI-themed trading market into the cryptocurrency market was considered a potential catalyst for a Bitcoin rise.
The Federal Reserve’s latest Beige Book report revealed that economic activity has generally seen moderate growth since early July, but concerns about energy prices, policy uncertainties, and international conflicts have increased.
According to the report, economic activity grew slightly to moderately in 10 of the Fed’s 12 regions, while two regions saw no significant change. Although consumer spending saw limited growth, it was noted that consumers have become more sensitive to prices. While spending by the upper income group remained strong, automobile sales were under pressure due to weak consumer confidence, high oil prices, and rising financing costs.
Manufacturing showed a recovery in most regions. Some Fed regions reported strong demand, particularly in orders related to defense and data centers.
The report noted a slowdown in labor market growth, with only a limited increase in total employment. While labor demand remained relatively strong in the manufacturing and construction sectors, demand for workers declined in the retail and hospitality sectors.
On the price side, while most regions reported moderate increases, it was emphasized that cost pressures stemming from energy, transportation, and raw material costs, as well as tariffs, continued.
According to the Fed’s field surveys, businesses generally maintain positive expectations regarding the economic outlook. However, the trajectory of energy prices, uncertainties in economic policies, and international conflicts are among the main risk factors for companies in the coming period.
A strong surge in network activity on Robinhood Chain has driven daily transaction fees to record levels, significantly boosting revenue for the Arbitrum ecosystem. According to DeFiLlama data, Robinhood Chain generated approximately $3.75 million in daily fee revenue on September 1st, reaching an all-time high for the fourth consecutive time. This performance propelled Robinhood Chain to the top fee-generating blockchain network of the day.
It is stated that 10% of Robinhood Chain’s fee revenue is shared with the Arbitrum Foundation. 80% of this share goes to the Arbitrum DAO, and the remaining 20% goes to the developer fund. Accordingly, just one day of Robinhood Chain activity generated approximately $370,000 in revenue for the Arbitrum ecosystem.
What’s remarkable about the figures is that the revenue generated from Robinhood Chain significantly exceeded the fee revenue from Arbitrum’s own mainnet. On the same day, it was reported that the total transaction fees generated by the Arbitrum network remained below $15,000.
DeFiling data also shows that the total value of assets locked on Robinhood Chain has reached approximately $757 million, while the stablecoin market capitalization has reached $833 million.
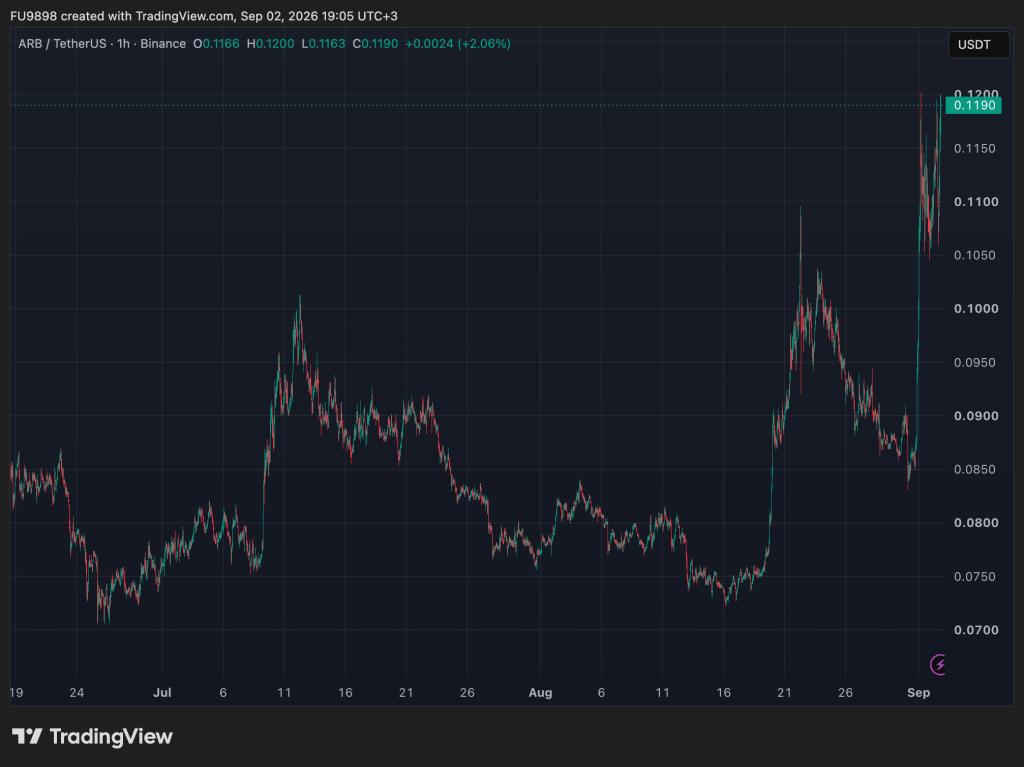
As a result of these developments, the price of Arbitrum ($ARB) also increased.
After a sharp rise in Bitcoin and altcoins, the trend has recently turned downwards, but a new study published by ARK Invest and Glassnode reveals noteworthy data regarding the decentralization of cryptocurrency networks.
A joint study by Ark Invest and Glassnode has revealed a remarkable picture of the decentralization of the Bitcoin, Ethereum, and Solana networks.
According to this study, in the Bitcoin and Ethereum networks, it is sufficient for three independent actors to act in coordination to reach the level considered a critical threshold. In contrast, Solana requires 19 organizations.
Three Bitcoin Mining Pools Exceed the 51% Threshold!
One of the most striking findings of the study concerned the Bitcoin network. The study revealed that Bitcoin requires three organizations each to accumulate enough processing power or stakes to influence block production.
At this point, the critical control threshold for Bitcoin is considered to be 51% of the network’s total mining power.
Research data for 2026 shows Foundry USA with 27.27%, AntPool with 17.06%, and F2Pool with 16.96% of hash power. The combined hash power of these three mining pools is sufficient to surpass the critical 51% threshold.
However, researchers also point out that this data does not mean that Bitcoin is controlled by three companies.
In Ethereum, the Critical Threshold is Three Actors!
In the case of Ethereum, the research uses a different threshold due to the structure of the Proof-of-Stake mechanism. For Ethereum, the critical threshold is considered to be 33% of the total stake amount.
According to the study, the critical threshold on the Ethereum network can only be surpassed by the total stake controlled by the three largest staking organizations. However, this does not mean that Ethereum is directly controlled by these three companies. These staking organizations perform verification on the network by pooling ETH belonging to numerous different users.
The Situation is Different in Solana!
The study concluded that, unlike Bitcoin and Ethereum, Solana requires the coordination of 19 independent assets to reach the same critical threshold. At this point, Solana sacrifices decentralization in exchange for higher performance and faster coordination.
The study concluded that even if a particular mining pool or validator constitutes a large share of the network, this does not automatically mean that the operator directly owns all of the underlying hash power or staked assets.
Bitcoin once again drew attention with its strong performance in August, and LMAX Group Market Strategist Joel Kruger, speaking to The Block, noted that the rise occurred despite challenging macroeconomic conditions.
Bitcoin’s Strong August Performance!
The leading cryptocurrency, Bitcoin, ended August with a strong gain.
At this point, $BTC has surged approximately 25% in August, marking its strongest August performance since 2017. This rise also marks the highest monthly gain since November 2024.
It Rose Despite Macroeconomic Pressures!
According to Joel Kruger, Bitcoin’s August performance occurred despite challenging market conditions. During the same period, bond yields rose, the US dollar strengthened, and geopolitical risks resurfaced.
Kruger noted that while these developments have put pressure on risky assets, it is remarkable that Bitcoin has remained strong.
The $80,000 Level is Critical!
Bitcoin started September at around $78,000, and according to Kruger, $BTC is holding onto most of the gains it made after the rally.
At this point, Kruger predicts that Bitcoin may enter a period of consolidation for now. Identifying the $80,000 to $82,820 range as a significant resistance zone for the coming days, Kruger added that a sustained move above this range could revive a rise towards $100,000.
Kruger concludes by stating that macroeconomic data from the US could be decisive in determining the direction of Bitcoin in the coming period. In particular, employment data and messages regarding the Fed’s interest rate policy will be closely watched in terms of risk appetite in the crypto market.
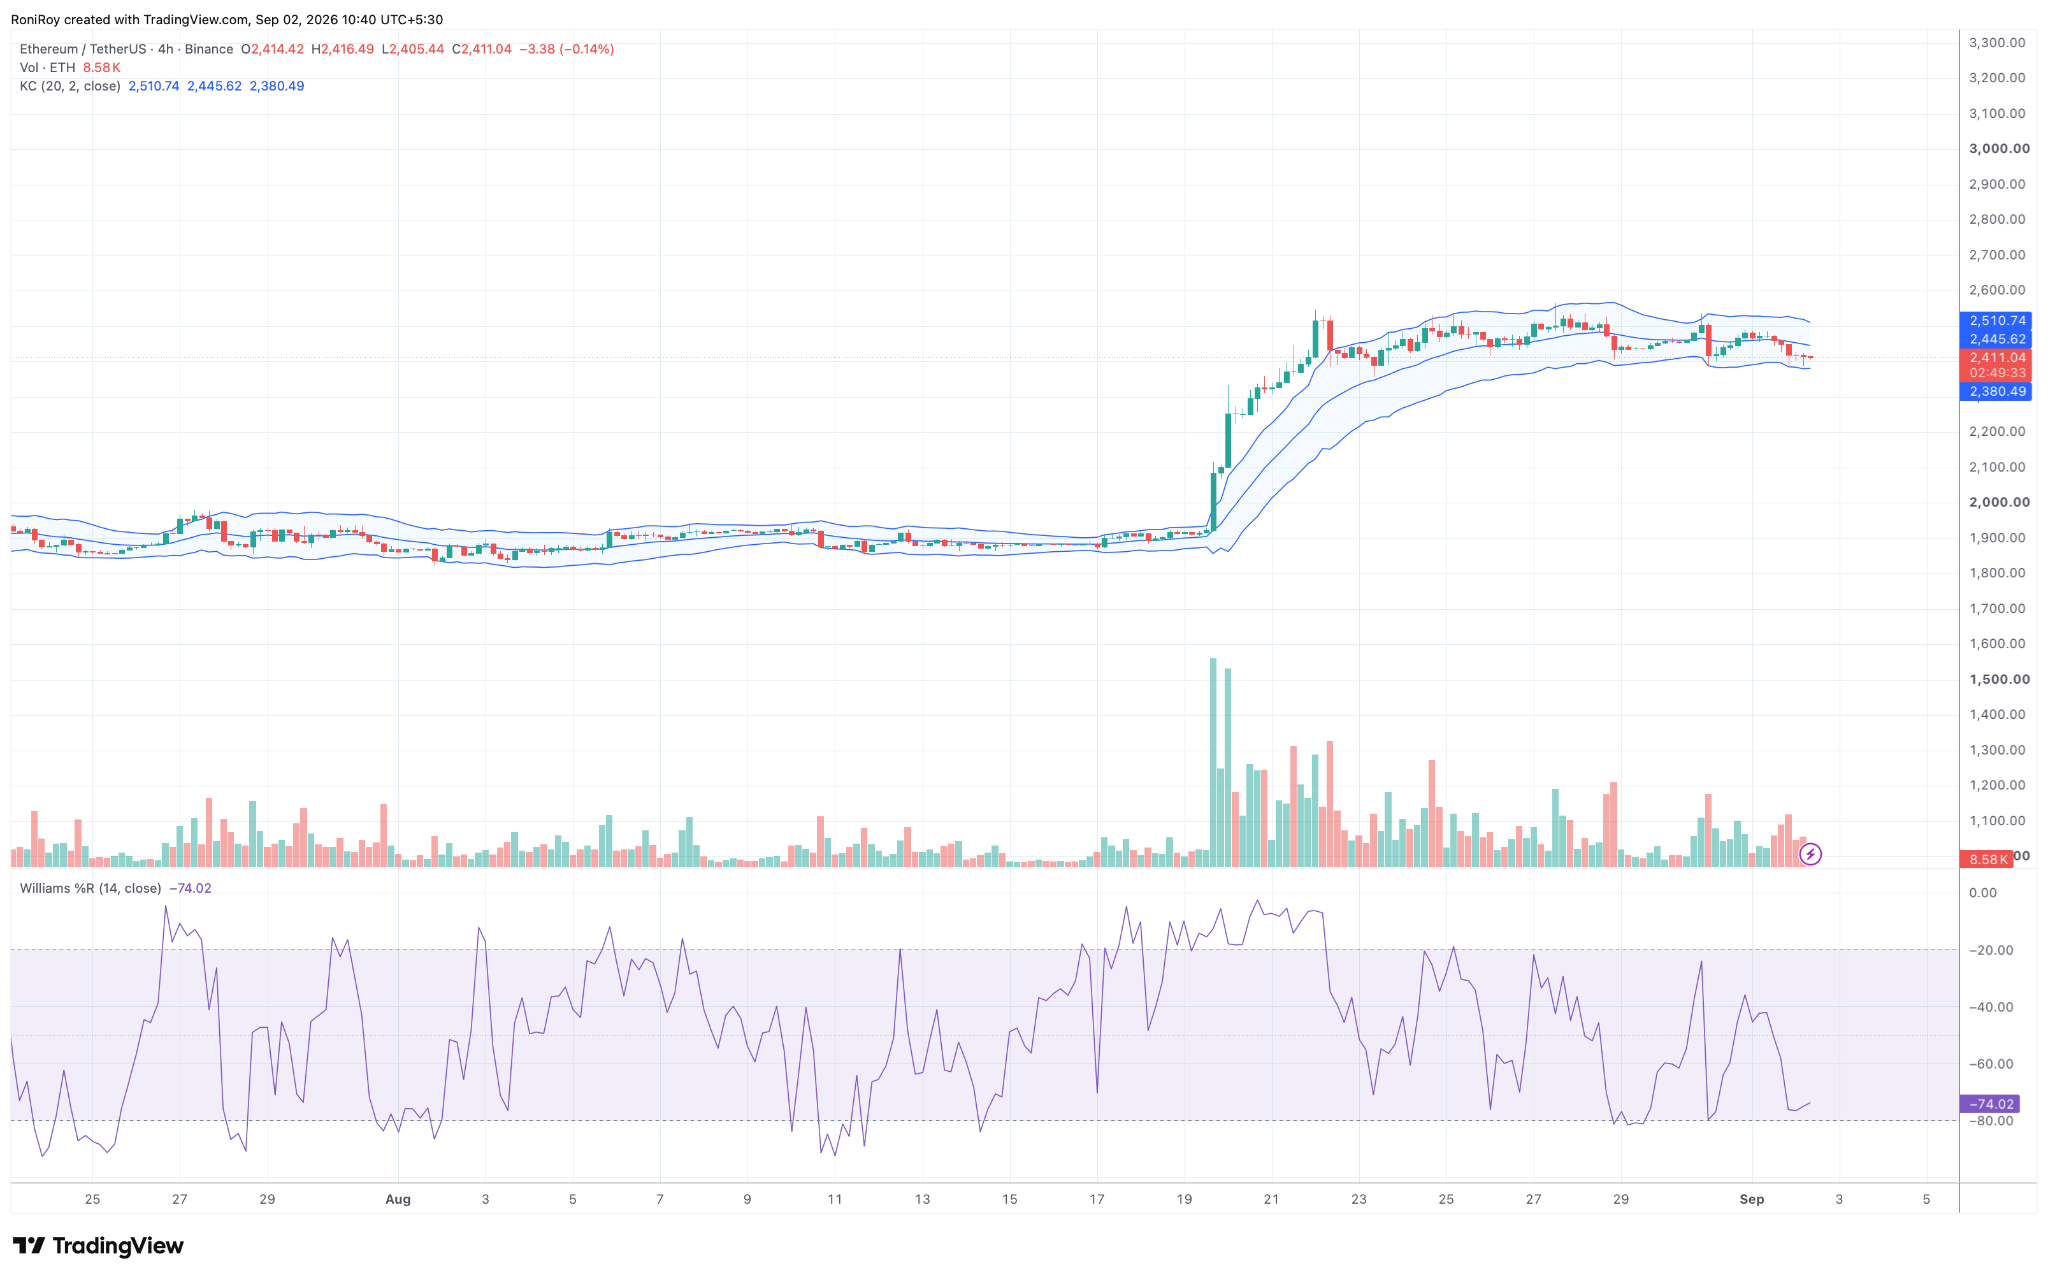
Ethereum has fallen 2.3% over the past 24 hours to roughly $2,414, putting the $2,400 level under pressure as geopolitical tensions, higher Treasury yields and large whale transfers weigh on $ETH.
CoinGecko puts $ETH at $2,414 at the time of writing, after the token fell from the $2,480 area and briefly traded below $2,400 during the past 24 hours.
Ethereum is also down 2.1% over the past seven days, although it remains up 26.6% over 14 days and 29.6% over the past month.
The latest decline has come as renewed fighting between the United States and Iran pushed investors away from risk assets.
Brent crude moved above $95 per barrel as the conflict raised concerns that higher energy costs could keep inflation elevated.
Bitcoin has fallen below $77,000 during the same risk-off move, while Solana, XRP and several other major cryptocurrencies have also traded lower.
$ETH‘s decline therefore comes as part of a crypto market sell-off instead of an Ethereum-specific move.
Pressure from the bond and currency markets has added to the decline. The US 10-year Treasury yield climbed to roughly 4.81%, its highest level since November 2023, while the dollar index reached its highest point since Aug. 17.
According to Reuters, traders are pricing a roughly 68% probability of a Federal Reserve rate increase in September as policymakers assess the inflation risk from higher energy prices.
Rising Treasury yields increase the return available from government debt, while a stronger dollar can reduce demand for risk assets including cryptocurrencies.
Ethereum also faces a large potential source of supply after a whale holding 167,855 $ETH, worth roughly $408 million, began moving tokens to exchanges.
The address transferred 70,739 $ETH worth $174 million to several exchanges over two days and still held roughly 97,115 $ETH.
Transfers to exchanges do not confirm that the entire amount will be sold. However, the size of the deposits has put the position in focus while $ETH trades close to $2,400.
Institutional demand has also eased from levels recorded during Ethereum’s late-August price rise.
Daily US spot Ethereum ETF inflows reached $234.5 million on Aug. 27 before falling to $102.2 million and then roughly $87.7 million on Aug. 31.
Trading volume across the products also fell towards the end of the month.
Ethereum’s Coinbase Premium Index has meanwhile moved into negative territory at roughly -0.014.
The reading means $ETH has been trading at a discount on Coinbase relative to other venues, compared with the positive premium seen during stronger US investor demand.
$ETH had already struggled to hold its late-August gains before the latest sell-off.
The token reached roughly $2,558 on Aug. 27 but failed to stay above $2,500, leaving the $2,480-$2,520 region as the main overhead resistance area.
$ETH price analysis
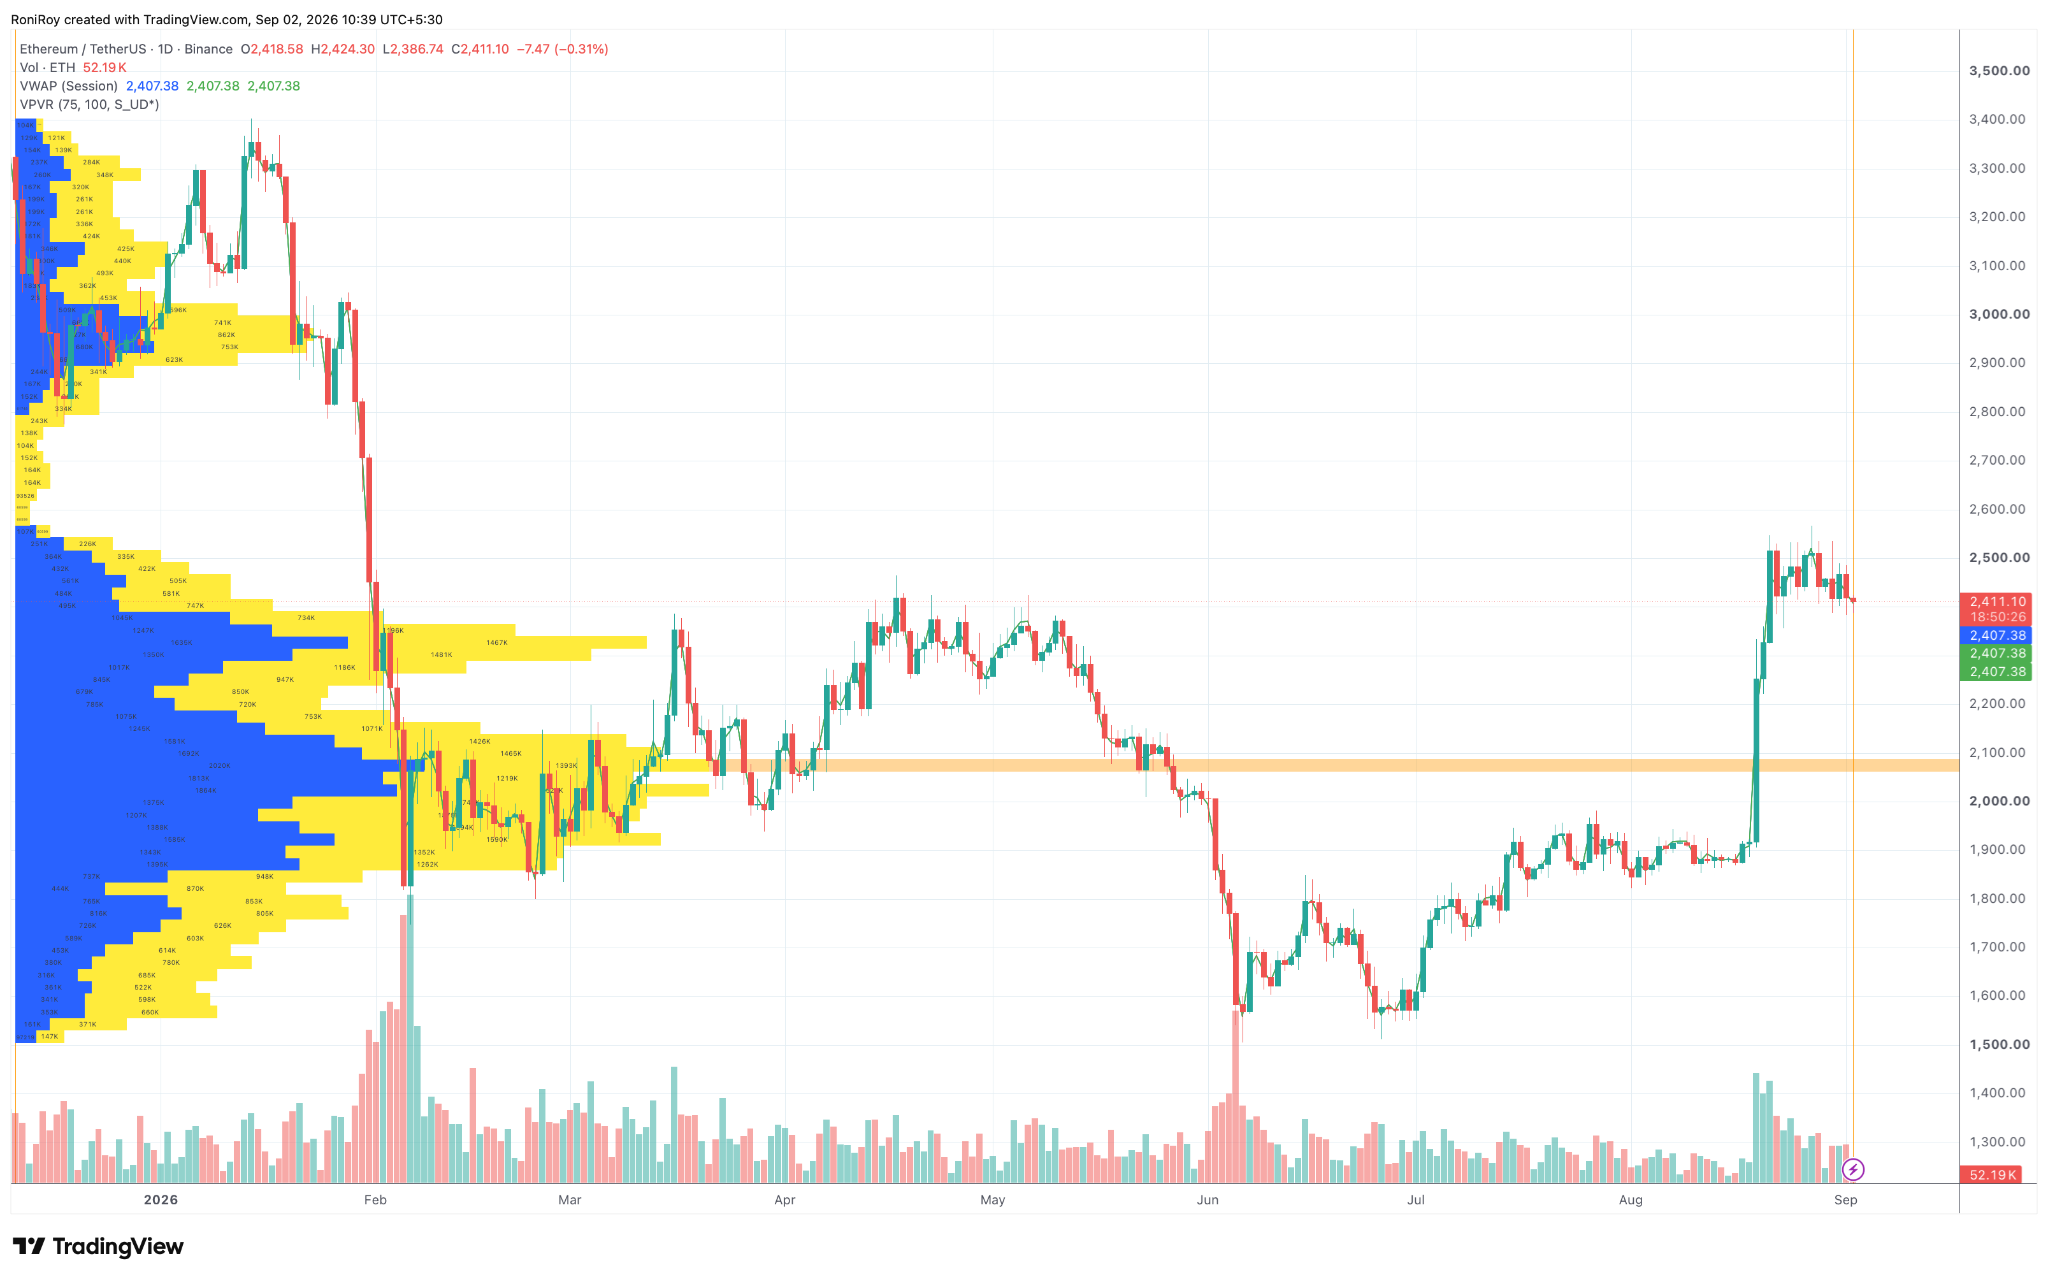
$ETH is trading near $2,411 on the daily chart after falling from the late-August high above $2,550. See below.
Price has returned almost exactly to the session VWAP at $2,407, leaving $2,400 as the first level that buyers need to defend.
The daily volume profile shows relatively little established trading volume between the current price and the much heavier volume area around $2,000-$2,100.
$ETH quickly broke through this region during its August surge, so a sustained move below the current consolidation could leave fewer high-volume areas to slow a sell-off before lower support comes into play.
The 4-hour Keltner Channel puts its middle band at roughly $2,446, with $ETH now trading below it.
The lower band sits near $2,380, while the upper boundary is around $2,511.
A move back above $2,446 would put $2,480 in reach, followed by the $2,500-$2,511 area.
A close above $2,511 would open a retest of the Aug. 27 high around $2,558.
Williams %R on the 4-hour chart has fallen to roughly -74. The oscillator is approaching its oversold region below -80 but has not entered it yet, leaving room for sellers to push $ETH lower before momentum reaches an extreme reading.
A drop below -80 alongside a test of $2,380 would make that level important for signs of a short-term rebound.
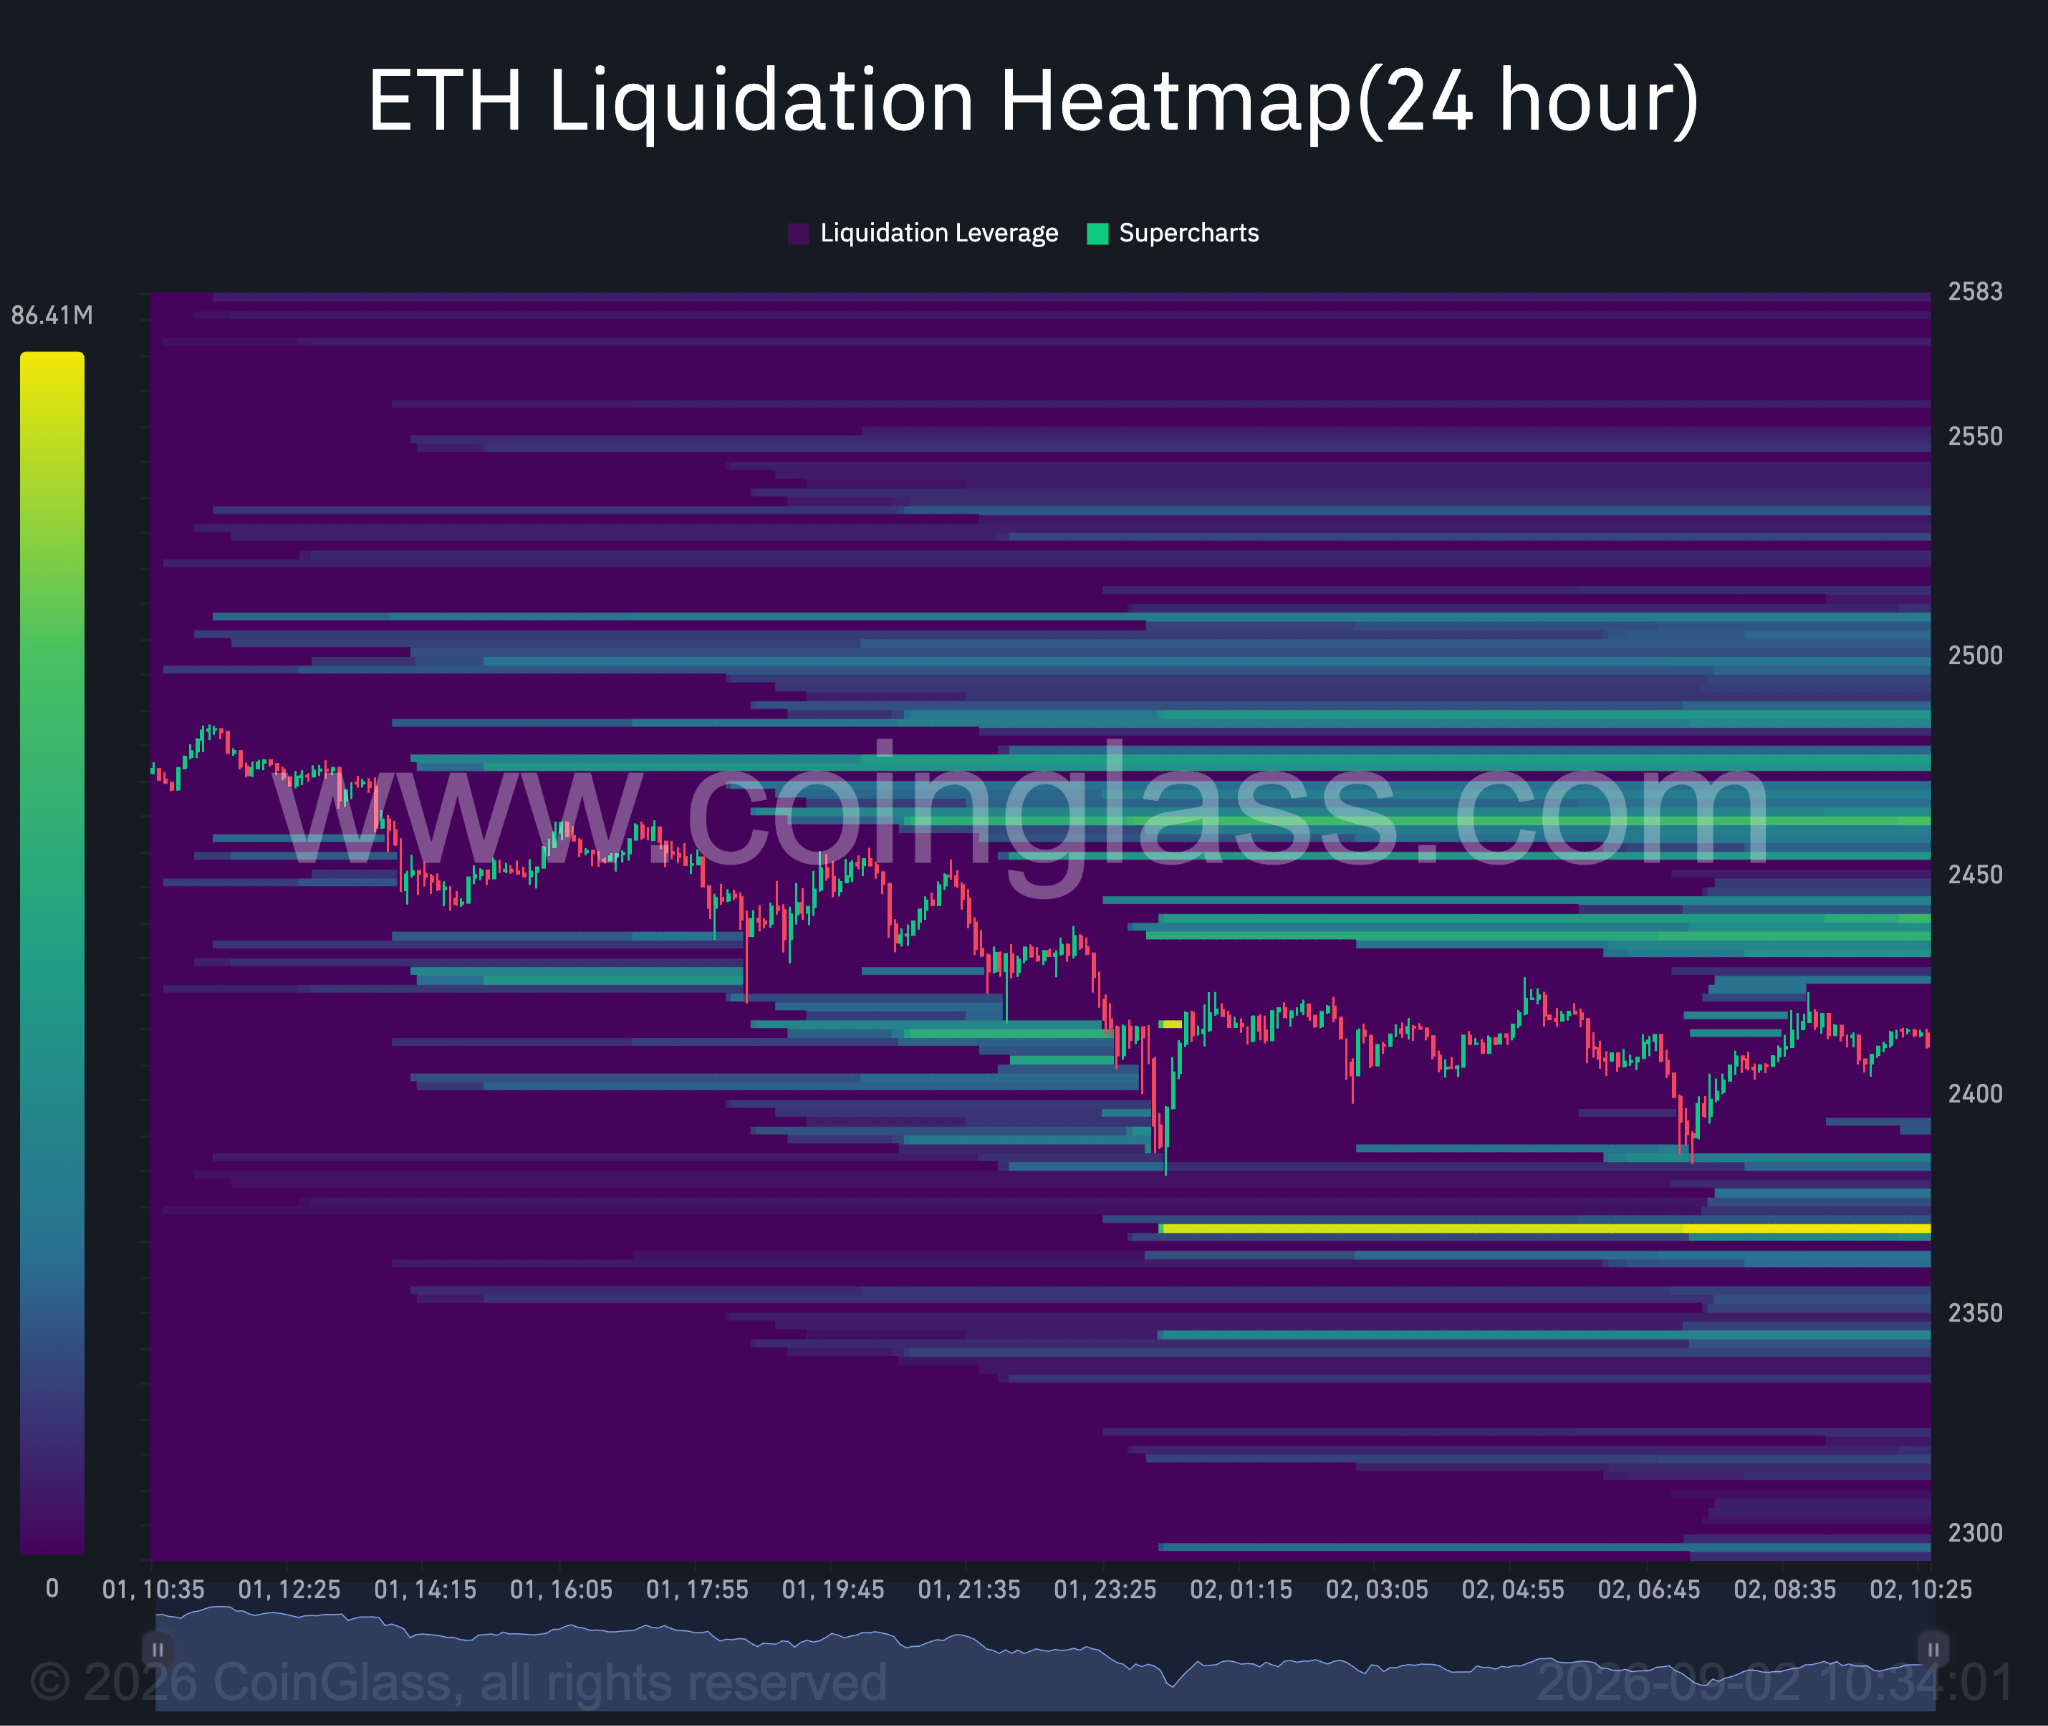
The 24-hour liquidation heatmap adds another level just below the Keltner support.
Monad‘s MIP-12 upgrade cut the network’s block time from 400 milliseconds to 300 milliseconds. It activated on mainnet on July 23, 2026, at round 89,758,000, and lowered Monad’s deterministic finality from about 800 milliseconds to roughly 600 milliseconds. The change came from Category Labs, the team that builds Monad, and it adjusted several other network settings at the same time.
What Is MIP-12?
MIP-12, short for Monad Improvement Proposal 12, is a governance change that shortened Monad’s consensus voting cycle by 100 milliseconds. Category Labs published the draft, the community reviewed it, and it went live through the v0.15.1 client release.
The proposal did more than shorten block time. It also lowered the block reward from 25 $MON to 18 $MON per block, a change sized to match the shorter production cycle, and it cut the block gas limit from 200 million to 150 million.
How Does Monad Produce Blocks So Fast?
Monad’s speed comes from splitting two jobs that most blockchains do together: agreeing on transaction order and running the transactions.
On Ethereum, validators must fully execute every transaction before voting on a block, leaving roughly 100 milliseconds of execution time inside a 12-second block.
Monad separates this into parallel pipelines. Validators agree on order first, through a mechanism called MonadBFT, then execution happens afterward with access to the full block window.
MonadBFT is a pipelined Byzantine Fault Tolerant protocol with linear message complexity, meaning validators don’t need to talk to every other validator on the normal path. It also resists tail-forking, a flaw in earlier pipelined designs where a bad-acting leader could fork away a previous block.
This design is what let Monad shorten block time without lowering gas throughput, which held steady at 500 megagas per second. To keep that rate, the per-block transaction limit dropped from 5,000 to 3,750, calculated by dividing the new 150 million gas limit by 40,000. The per-transaction gas limit stayed unchanged at 30 million.
What Does Faster Finality Mean In Practice?
Finality is the point where a transaction can’t be reversed except in rare edge cases. Before MIP-12, Monad reached deterministic finality in two consensus rounds, about 800 milliseconds, and speculative finality in one round, about 400 milliseconds. After the upgrade, those numbers dropped to roughly 600 milliseconds and 300 milliseconds. For applications like high-frequency trading or onchain gaming, that gap is what users actually feel.
How Does Monad Compare To Other Layer-1 Chains?
Block time alone doesn’t tell the whole story, since chains define finality differently. Still, the comparison shows where Monad now sits.
Ethereum: 12-second block time, about 16 minutes to finality
Solana: 400-millisecond block time today, moving toward a 200-millisecond target
Base: 2-second block time, about 13 minutes to finality
Arbitrum: 250-millisecond block time
Robinhood Chain: 100-millisecond block time
Monad: 300-millisecond block time, about 600 milliseconds to deterministic finality
Monad keeps full EVM compatibility while running on consumer-grade hardware across a validator set spread over more than 30 countries, which separates it from chains that need specialized infrastructure to hit similar speeds.
What Comes Next For Monad And $MON?
$MON has traded in a wide range through 2026 and is currently changing hands around $0.025 to $0.029. The token gained more than 44% over one week in late August, rising from about $0.020 toward $0.029, after the Monad Foundation announced on August 18 a program to buy back up to $60 million in locked $MON from early investors at a discount. Network total value locked has climbed alongside that rally, approaching $1 billion by late August, up from roughly $868 million earlier in the month.
Entropy Advisors data lead Tom Wan flagged the 300-millisecond milestone publicly when it activated, framing it alongside Solana’s own push toward 200-millisecond blocks. The next scheduled event for $MON holders is a token unlock on November 24, 2026, separate from this technical upgrade but likely to shape trading conditions around it.
MIP-12 lowered Monad’s block time to 300 milliseconds, cut deterministic finality to about 600 milliseconds, and rebalanced block rewards and gas limits to match. The upgrade runs on Monad’s existing split between transaction ordering and execution through MonadBFT, and it holds gas throughput steady at 500 megagas per second on a distributed, consumer-hardware validator set.
Conclusion
MIP-12 lowered Monad’s block time to 300 milliseconds, cut deterministic finality to about 600 milliseconds, and rebalanced block rewards and gas limits to match. The upgrade runs on Monad’s existing split between transaction ordering and execution through MonadBFT, and it holds gas throughput steady at 500 megagas per second on a distributed, consumer-hardware validator set.
Resources
Monad Documentation: Releases changelog covering v0.15.0, v0.15.1, and MIP-12 activation