$HYPE, the native cryptocurrency of the decentralized exchange (DEX), Hyperliquid, is up over 2% on Saturday to trade at $36.3. This surge can be associated with increasing trading activity on Hyperliquid’s HIP-3 platform as traditional stock and commodity markets are closed for the weekend. Amid the success of HIP-3 commodity markets, analysts predict that the platform’s buyback-and-burn mechanism remains a primary counter-force for the upcoming token unlock on April 6th. Is Hyperliquid price poised for a bullish rebound?
Hyperliquid Faces $356M Token Unlock as April 6 Cliff Approaches
The Hyperliquid ecosystem is preparing a major liquidity event on April 6, 2026, when the protocol will have the next monthly “cliff” in its vesting schedule. Based on the on-chain data and tokenomic trackers such as Tokenomist, up to 9.92 million $HYPE tokens can be eligible to be released under the core contributor vesting contracts, which is estimated at about $356.6 million in value at the current price level.
This translates to about 2.66% of the existing circulating supply and is one of the highest unlock potentials of the asset in a single day in this week.
Although the headline number of approximately 10 million tokens has been a jitter in the market, past trends indicate that the real sell pressure could be much less. The Hyperliquid Foundation has reported that the next claim in this cycle will be around 330,000 $HYPE ($12.1M).
In previous months, the core team has historically claimed only a small fraction (ranging from 1.4% to 17%) of their available tokens, choosing to keep the remainder locked or in protocol treasuries to maintain market stability.
Traders are closely watching how the market absorbs this supply, especially given Hyperliquid’s current dominance in the decentralized perpetual exchange (Perp DEX) space. The buyback-and-burn mechanism of the platform continues to be a major counter-force with the volumes recently reaching an all-time high of $5.4 billion as a result of the success of the HIP-3 commodity markets.
This mechanism involving protocol fees to take $HYPE off the market has played a successful role in dampening the effects of the past unlocks, to the extent that some analysts are now considering the April 6th occurrence as an absence of event, instead of a bearish event.
Hyperliquid Price Faces 7% Drop Before Major Breakdown or Reversal
Over the past two weeks, the Hyperliquid price witnessed a sharp correction from $43.76 to current trading price of $36.5, registering a loss of 16.53%. This pullback aligns with broader market correction amid the escalating geopolitical tension and volatile oil price.
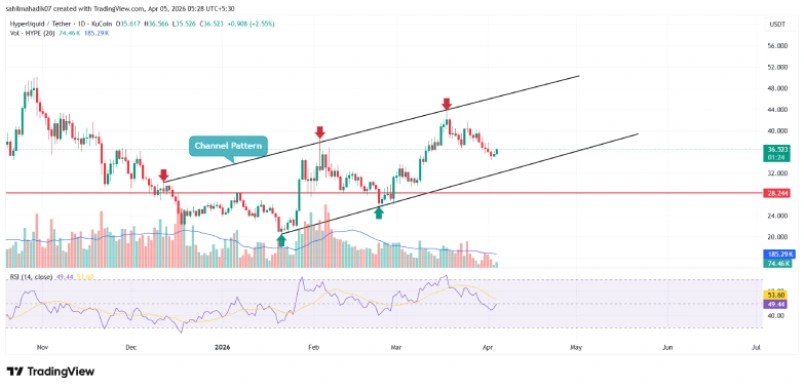
However, a deeper analysis of the technical chart shows this pullback is part of occasional correction amid the formation of a rising channel pattern. Since mid-June 2026, the $HYPE price has witnessed a steady rise within two ascending trendlines on the daily chart.
If the pattern holds true, the Hyperliquid price could drop another 7% and retest the bottom trendline at the $34 mark. The potential retest is a pivot moment for $HYPE to determine the next price trajectory.
If the sellers force a breakdown below the bottom trendline, the Hyperliquid price could plunge to the next significant support of $28 with accelerated selling pressure.
$HYPE/USDT -1d Chart
On the contrary, if buyers showcased sustainability of the channel support, the coin price could attempt it’s next rebound.
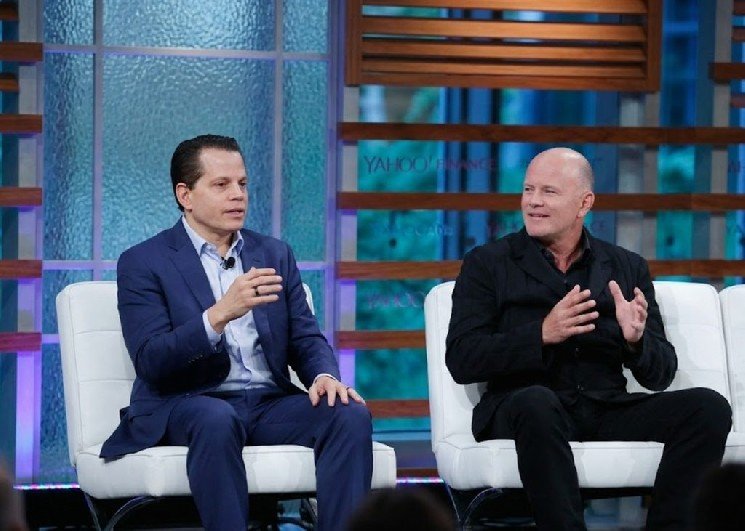
Two prominent figures in the financial world, Anthony Scaramucci and Michael Novogratz, came together on the “All Things Markets” program to assess the stagnation in the cryptocurrency markets and their future growth potential.
Novogratz argued that regulatory uncertainty, particularly in the US, was weighing on the market, and that regulations like the Clarity Act were critical to increasing institutional interest.
Speaking at a time when Bitcoin was consolidating around the $60,000 level, Novogratz stated that the market was currently in a “stalemate” state.
Novogratz, while appreciating Coinbase CEO Brian Armstrong’s firm stance against regulatory pressure, argued that senators caught between crypto and banking lobbies were hindering the process. He predicts that a much larger influx of capital into the market would occur if the laws were clarified.
Related NewsJUST IN: U.S.-Iran Talks Have Stalled; Pakistan Talks May Be Canceled
Novogratz stated that one of the biggest catalysts for the cryptocurrency market is the change in governance and the SEC’s stance. He said the current situation is evolving from an “anti-crypto” to a “crypto-friendly” structure, and argued that for this momentum to be permanent, regulations need to be codified into law.
He also added that promises from figures like Donald Trump to “make the US the Bitcoin capital” have kept expectations alive in the sector.
The program also discussed Michael Saylor’s company MicroStrategy’s (MSTR) Bitcoin strategy. Scaramucci pointed out the company’s securities offering returns of around 11%, while Novogratz reminded viewers that this was essentially Bitcoin leverage.
He stated that in an extreme scenario, such as Bitcoin’s price falling to $30,000, this structure could be risky, but in the current situation, Saylor has a significant “buffer” at his disposal.
As the global economy faces the risk of renewed stagflation due to rising geopolitical tensions, auditing and consulting firm KPMG has issued a striking warning.
Diane Swonk, the company’s chief economist, stated that the war with Iran, in particular, has severely disrupted economic balances and could force central banks to take unexpected steps.
According to Swonk, the risk of stagflation is becoming increasingly pronounced when rising global energy prices and economic slowdown are considered together. Stagflation is a situation where high inflation and weak economic growth occur simultaneously, presenting an extremely difficult scenario for policymakers to resolve. Swonk warned that if this process cannot be brought under control, the US economy could be dragged into a “deep recession.”
Related NewsVanEck Expert Matthew Sigel: “The Four-Year Cycle in Bitcoin Holds True; We Bought at $60,000, But…”
Swonk noted that the closure of the Strait of Hormuz, in particular, led to a sharp rise in oil prices, adding that the developments went far beyond a classic oil shock. He stated that rising energy costs increased production and logistics expenses, creating persistent pressure on overall price levels, and that companies significantly reduced hiring in this environment.
The combination of all these developments is causing both high inflation and weakening economic growth, and investors appear to share similar concerns. In his assessment of the current situation, Swonk stated that the Fed may be forced to raise interest rates in the second half of the year. He added that this step might not be limited to the US alone, and that other major central banks could similarly adopt tightening policies.
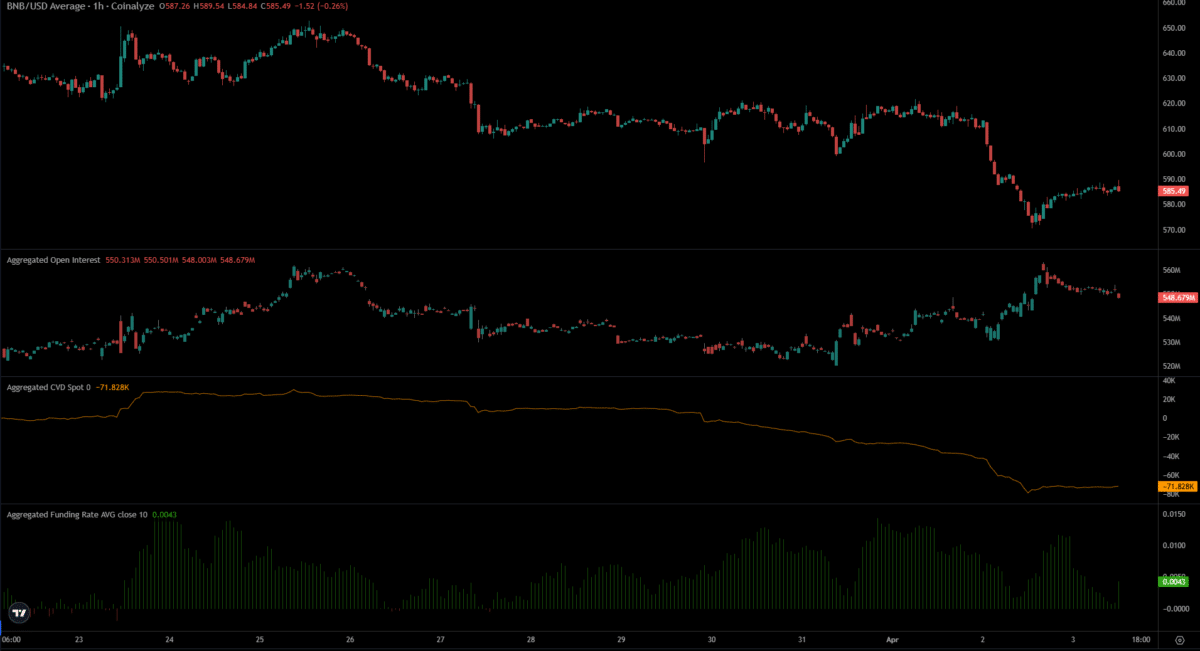
Binance Coin [$BNB] has retested the lows it established on Friday, the 6th of February, at $570. This was a worrisome sign for bulls and long-term investors, as it was a sign of bearish dominance.
Source: Coinalyze
The sellers were threatening to drive prices below the swing low at $570 and force the exchange token on its next downward move. The Coinalyze data agreed with the bearish dominance.
While the funding rate remained positive, the spot CVD has been steadily falling over the past week. Additionally, when the $BNB price fell to $570, the Open Interest rose from $530 million to $560 million.
This meant that short sellers were entering the market during the move lower. The OI has slowed down since then, as the price briefly bounced to the $590 resistance.
The $BNB woes are not just short-term
The relative weakness against Bitcoin [BTC] was a worry. The leading crypto’s February low was at $66k, and the current market price is $66.6k. Meanwhile, $BNB tested the February lows.
Speculative conviction and a lack of demand could drive $BNB even lower.
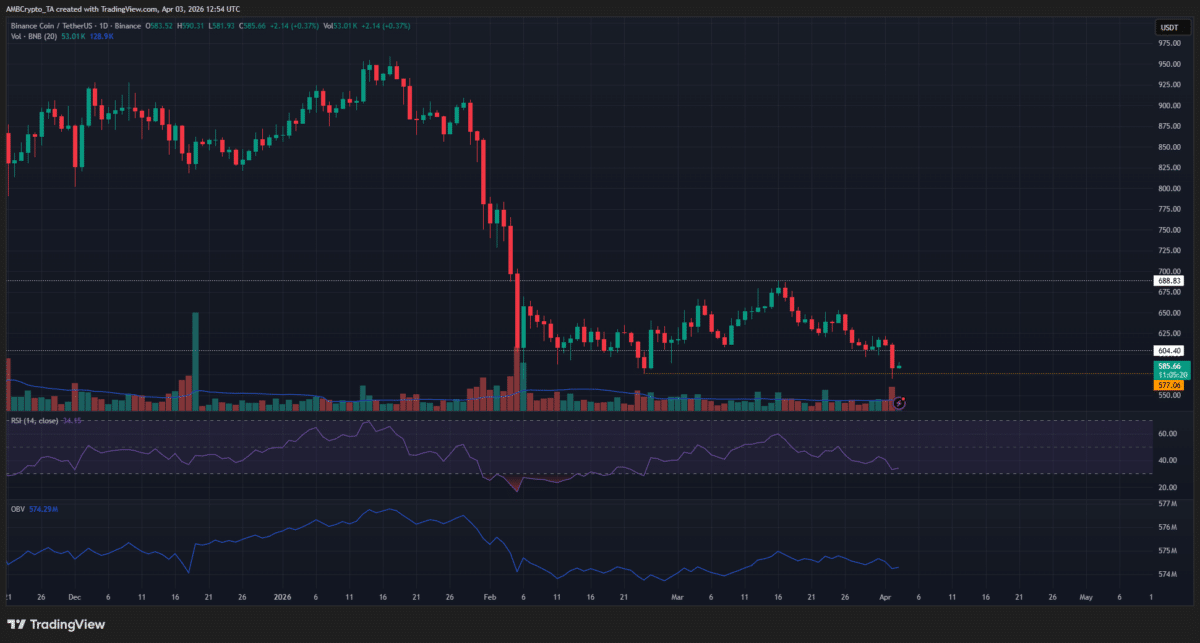
Source: $BNB/USDT on TradingView
The RSI on the 1-day timeframe was at 34, showing strong bearish momentum. The OBV bounced higher in March but was slowly falling once more.
The $577 and $604 were the key levels to keep an eye on in the next few days. A bounce back above $604 would be a short-term win for the bulls, although they won’t get to dictate the overall trend.
Meanwhile, losing the $577 support will mean that the next target would be $530.
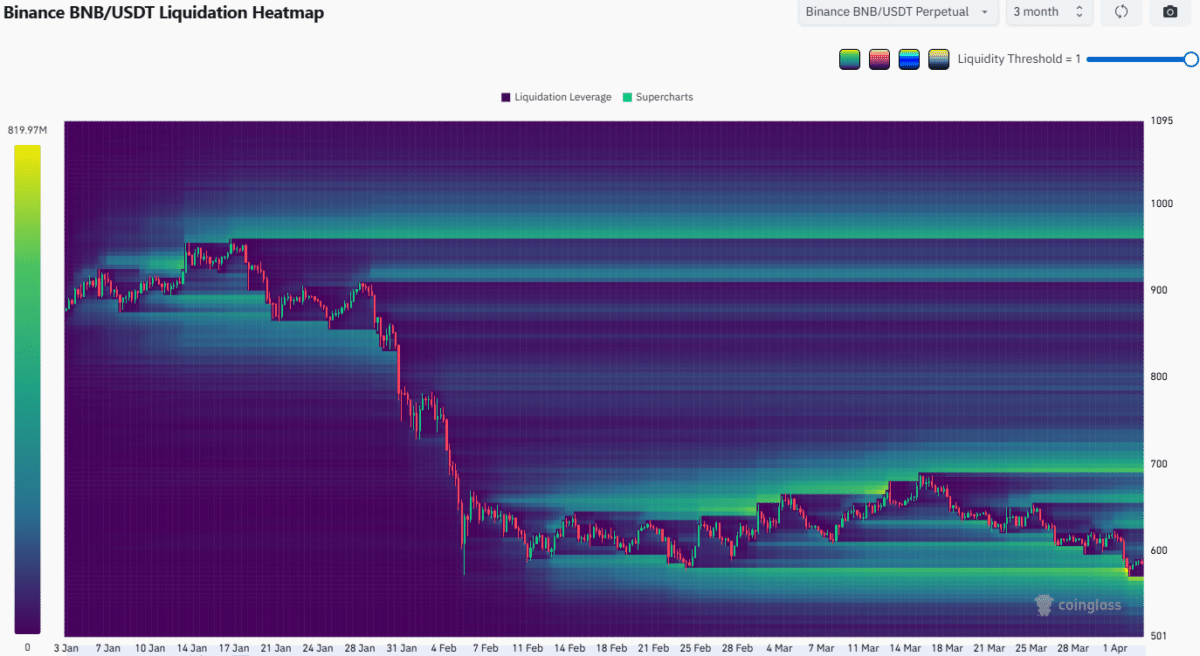
Source: CoinGlass
The 3-month liquidation heatmap showed that further downside was likely. There was a cluster of liquidity built up around $565 that could drag $BNB lower.
To the north, the $650 and $700 regions had long liquidations and could be targeted in case of a price bounce.
Based on the evidence at hand, traders should anticipate a $BNB move toward $530 next. A bounce to $600, or even as high as $650-$700, would be for selling.
Final Summary
$BNB fell swiftly on Thursday, the 2nd of April, to test the $570 support level that marked the February crash’s low.
The surge in Open Interest during Thursday’s price drop signaled bearish speculative conviction.
Renowned macrostrategist Lyn Alden, in a recent program, described the current state of the global financial system as a “slow collapse,” detailing how individuals are exploited within this system and why Bitcoin (BTC) is the only real way out of this cycle.
According to Alden, the current fiat currency system, due to its debt-based structure, must either grow or die. He argues that governments and large corporations are “shorting” the system by exploiting its loopholes, while ordinary citizens are on the losing side of this game.
“The wealthy and institutions are shorting money by borrowing at low interest rates and buying scarce assets. The poorest, unable to borrow, are bearing the brunt of inflation as their salaries and savings erode.”
In the section on Bitcoin, Alden describes the historical development of money as an evolution of a “ledger.” He lists the advantages offered by Bitcoin’s digital and decentralized structure in contrast to the physical limitations of gold and silver as follows:
Zero Supply Increase: In a world where emerging market currencies have increased by 20%, developed market currencies by 7%, and gold by 2%, Bitcoin is the only asset that will not experience further supply increases beyond a certain point.
Decentralized Trust: Alden reminds us that Bitcoin is not governed by a “council” or “policymaker,” and the rule set is distributed among all users, stating that no one can “debase” the system (empty the value from the currency) for their own benefit.
Energy-Based Security: Unlike systems where fiat currencies can be multiplied with the snap of a finger (by printing money), Bitcoin production and transfer require real-world energy (Proof of Work).
Lyn Alden notes that Bitcoin, with its 17-year history (the Lindy effect), is beginning to prove its worth, and that volatility is a natural price to pay for the adoption of such a new and rare asset.
Alden’s warning is clear: no matter what we do, we cannot escape understanding how money works. The analyst argues that the current system is run by “faulty money,” and that Bitcoin, as a global ledger operating without a central authority, is the strongest alternative for those seeking to escape financial pressure.
Alden points out that since the 2008 crisis, private sector debt has been shifted onto the public sector, and this debt can only be repaid through inflation. According to Alden, the way out of this “hidden tax” cycle is to transition to rare assets that cannot be printed and can be digitally verified.
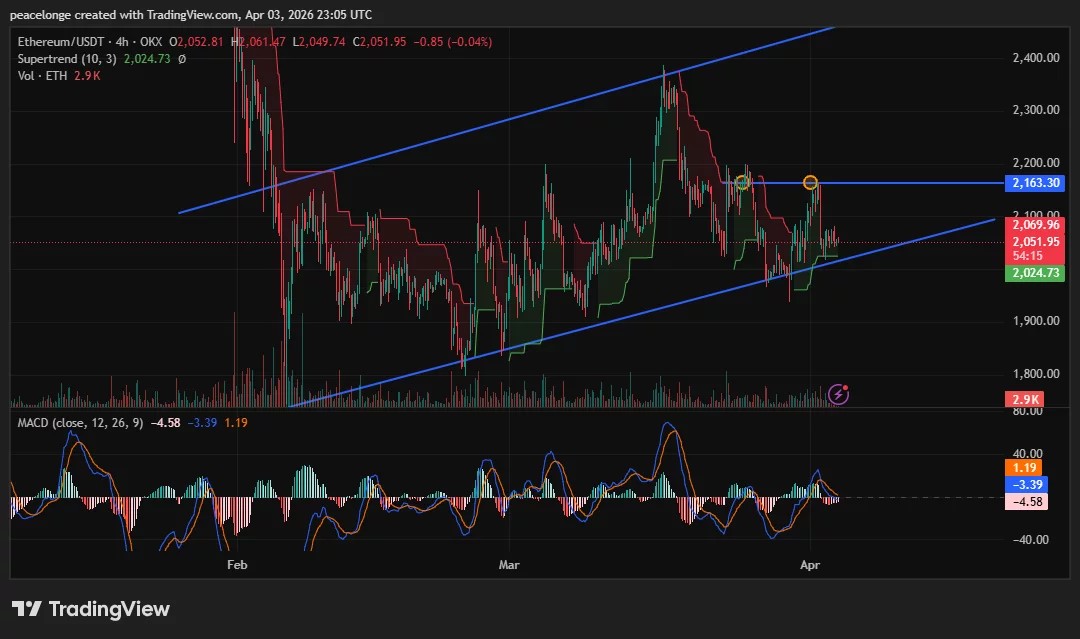
Ethereum is pressing against a double-top resistance zone at $2,163 after two consecutive rejections from the upper boundary of its rising parallel channel, while a marginal bullish MACD crossover on the 4H chart raises the question of whether buyers can finally break through or whether the pattern will resolve to the downside toward $1,980.
Ethereum (ETH) is trading at $2,051.80 on April 3, 2026, holding inside a rising parallel channel that has been intact since the February lows. Two consecutive rejection candles at the $2,163-$2,166 zone, marked clearly on both the 4H and daily charts, have created a double-top structure at the channel’s upper boundary. With $6.3 billion in Ethereum options having expired today and CME futures offline for Good Friday, traders face a thin-liquidity weekend that could amplify any directional move.
On the 4H chart, Ethereum is trading between the channel’s lower support near $2,024 and the upper resistance at $2,163. The 4H Supertrend at $2,024.73 is still green, confirming the short-term trend has not flipped bearish. More notably, the 4H MACD histogram has just crossed into positive territory at 1.19, with the MACD line at -3.39 crossing above the signal line at -4.58. This is a marginal but technically meaningful bullish crossover, the first since mid-March.
On the daily chart, the picture is more cautious. The MACD histogram sits at -7.33, with the MACD line at -11.11 still below the signal at -3.78. The daily Supertrend at $1,980.92 remains green, meaning the daily trend has not broken bearish. Two orange markers on the chart precisely identify the double-top rejection zone at $2,163-$2,166. A daily close above $2,166 would invalidate the double-top and confirm the rising channel’s upper trendline as the next target.
Key Levels, Price Targets, and Invalidation
Support is layered at $2,024 (4H Supertrend) and $1,980 (daily Supertrend). A daily close below $1,980 would flip the daily Supertrend bearish and break the rising channel structure that has defined price since February, opening a move toward $1,900 as the next major floor.
Resistance: the $2,069 area (the 4H Supertrend upper band visible on the chart) acts as a near-term ceiling, then the double-top zone at $2,163-$2,166. A clean daily close above $2,166 targets $2,250 initially, with $2,300-$2,400 as the broader bull case if the channel’s upper trendline is the objective.
Invalidation for the bullish channel thesis: a 4H close below $2,024 Supertrend support. Invalidation for the bearish double-top thesis: a daily close above $2,200.
Options Expiry and Macro Context
Approximately $6.3 billion in Ethereum options expired on April 3, according to data from Deribit, with spot price trading near the max pain zone for the expiry. Analysts at AnalyticsInsight noted the event is “more like a routine settlement than a major turning point,” given price proximity to max pain, limiting the probability of an expiry-driven spike in either direction.
As crypto.news reported, Ethereum fell 3.4% toward the $2,000 support on April 2 during the broader market selloff tied to U.S.-Iran escalation and the $285 million Drift Protocol exploit on Solana. The fact that the 4H Supertrend held at $2,024 through that sell event is a meaningful signal of buyer resilience at that level.
A sustained hold above $2,024 heading into next week, particularly with the 4H MACD histogram staying positive, would be the first concrete signal that bulls are retaking short-term control. If $2,024 fails, the double-top breakdown and a move toward $1,900 become the primary scenario to watch.
Ripple is driving measurable economic impact through its $RLUSD initiative, channeling millions into underserved U.S. small businesses while expanding access to capital and supporting job creation.
Ripple $RLUSD Funding Drives Small Business Growth Across the United States
Blockchain payments company Ripple shared on social media platform X on April 2 an update about its $15 million $RLUSD contribution. The post highlighted lending activity, job creation, and expanded financial access for small business owners across the United States, alongside engagement metrics showing 51.6K views.
“Last September, Ripple donated $15M $RLUSD issued on XRPL to Accion Opportunity Fund,” the crypto firm stated, adding:
“Here’s what’s unlocked for small business owners across the U.S.: $53.6M in capital deployed, 905 loans to 895 unique borrowers, $59K average loan size, 1,003 jobs created, 1,631 retained.”
The initiative focuses on expanding access to affordable capital, advisory services, and financial education for underserved entrepreneurs.
Accion Opportunity Fund uses the contribution to scale lending programs and provide structured business support. The model combines financing with mentorship and digital tools that help owners manage growth. This approach targets long-term sustainability rather than short-term funding gaps, strengthening business outcomes across diverse communities.
Blockchain Lending Model Expands Financial Access and Job Creation Impact
The program also integrates learning platforms that help entrepreneurs improve financial literacy and operational decision-making over time. Participants gain access to tailored resources, workshops, and advisory networks that address specific business challenges. These efforts aim to reduce barriers that often limit growth opportunities for smaller enterprises. By combining capital with education, the initiative supports more resilient business models and encourages sustainable expansion across different industries.
The broader results show how blockchain-enabled funding can integrate with traditional lending frameworks to produce measurable economic effects. Reported outcomes include job support, increased economic output, and expanded borrower reach. Ripple continues advancing its strategy of applying blockchain infrastructure to real-world financial challenges.
Ripple’s Senior Vice President of Strategic Initiatives Eric van Miltenburg shared on X:
“Very proud of the work Ripple is doing with Accion Opportunity Fund. Awesome to see $RLUSD driving real world value for small business owners!”
FAQ 🧭
How is Ripple using $RLUSD to support small businesses in the United States? Ripple deployed $RLUSD through the Accion Opportunity Fund to expand lending, financial education, and advisory services for underserved entrepreneurs.
What economic impact has Ripple’s $RLUSD initiative generated so far? The program has driven tens of millions in capital deployment, supported job creation and retention, and expanded access to funding for hundreds of borrowers.
Why is blockchain important in Ripple’s small business funding strategy? Blockchain enables efficient, scalable capital distribution while integrating with traditional lending systems to deliver measurable economic outcomes.
What makes Ripple’s partnership with Accion Opportunity Fund significant for investors? The collaboration demonstrates real-world utility of blockchain finance in driving sustainable growth and expanding financial inclusion across diverse markets.
Riot Platforms sold more than $250 million in BTC during Q1.
The firm, which has begun pivoting into AI, has now sold Bitcoin in consecutive quarters.
Shares in RIOT finished Thursday up nearly 2.5%, but are down 33% in the last six months.
Publicly traded Bitcoin miner Riot Platforms parted ways with more than $250 million worth of BTC during the first quarter of the year, the firm announced on Thursday.
The firm sold 3,778 Bitcoin at an average price of more than $76,000, decreasing its total holdings to 15,680 BTC at the end of Q1—now valued around $1.04 billion as Bitcoin changes hands at $66,844.
The Colorado-based miner has now sold Bitcoin in consecutive quarters, after netting proceeds of nearly $200 million from sales of the top cryptocurrency during November and December.
At that time, speculation was that the funds would be used to fund capital expenditures for its entry into the AI sector, a pivot that nearly all Bitcoin miners are making. For example, publicly traded miner Bitfarms recently announced it was completely detaching itself from Bitcoin to focus on AI. Additionally, one of Riot’s major Bitcoin mining rivals, MARA, recently sold $1.1 billion in BTC to help fuel its pivot into AI.
A representative for the firm did not immediately respond to Decrypt’s request for comment about what its proceeds may be used for.
Those ongoing operations are particularly focused on AI and other high-performance computing needs moving forward, according to the firm’s most recent strategic business update.
“2025 marked a watershed year for Riot, defined by a strategic evolution in our business that has transformed our future trajectory,” Les said in a statement in early March. “By unlocking our large, nearly two-gigawatt power portfolio for high-demand data center infrastructure, we are driving significant shareholder value.”
The firm, which has used nearly its entire power portfolio for Bitcoin mining thus far, added that its long-term goal is “to fully utilize our power portfolio for data center development.”
Its Bitcoin sales may be helping move in that direction—one that an activist investor recently suggested required a “renewed sense of urgency” in order to fully capitalize on the AI opportunity before it. That opportunity, the investor Starboard Value said, could be worth as much as a $21 billion boost to the firm’s valuation.
Shares of RIOT finished up 2.47% on Thursday, recently trading at $12.86.
Shares have dipped more than 33% in the last six months as Bitcoin has slid 47% from its all-time high of $126,080.
Daily Debrief Newsletter
Start every day with the top news stories right now, plus original features, a podcast, videos and more.
Bitcoin posted its worst quarterly performance since 2018, falling about 22%.
The cryptocurrency outperformed equities and gold after the Iran war outbreak.
Analysts point to Fed policy and a resolution to the Middle East conflict as key Q2 catalysts.
Bitcoin closed the first quarter of 2026 with its worst performance since early 2018, shedding nearly a quarter of its value as war, tariffs, and a hawkish Federal Reserve battered risk assets.
The cryptocurrency fell from around $95,000 in February to roughly $66,700 by quarter’s end, a decline of about 22% year-to-date, according to a report from institutional trading firm Talos citing data from its financial intelligence arm, Coin Metrics. Losses reached as much as 34.6% at the quarter’s lowest point, per the firm.
Bitcoin remains pinned in a $66,000-$70,000 range with whale transfers at multi-year lows and no meaningful bid defending levels, according to a Wintermute research note shared with Decrypt.
Institutions and retail investors alike “sit on the sidelines, unwilling to commit capital” until they see regulatory clarity or a shift in geopolitical conditions, the trading firm added.
Despite its bruising quarter, Bitcoin held up better than equities and gold after the February 28 outbreak of the Iran war, falling just 1.5% compared to a 17% drop in gold, a 7.6% decline in the Nasdaq, and a 7.4% slide in the S&P 500 over the same period, per data from Talos.
Bitcoin’s performance for the quarter appears to be more of a “macro-driven reset than a structural shift,” Samar Sen, head of international markets at Talos, told Decrypt.
“Crypto, alongside other risk assets, came under pressure following the escalation of the Iran conflict, alongside tariffs and tighter policy expectations,” he added.
U.S. spot Bitcoin ETFs hold roughly $100 billion in assets and saw net inflows resume in March, suggesting institutional demand has weathered the drawdown, Sen explained.
Liquidity across order books has also recovered from late-2025 lows allowing markets to “absorb larger moves,” with market structure “holding up more consistently” than in previous cycles, he added.
“Periods of macro uncertainty tend to slow risk appetite, but they also tend to bring a greater focus on risk management and portfolio diversification, and we’re seeing continued institutional engagement in that context,” he said.
Reaching for a reset
U.S. monetary policy could prove the most important variable for Bitcoin’s near-term trajectory, according to Zeus Research analyst Dominick John, who told Decrypt a Fed pause or easing would “release liquidity, lift risk appetite, and help stabilize Bitcoin,” while continued hawkishness “could tighten liquidity and increase selling pressure.”
A resolution to the ongoing Middle East conflict could provide a “critical catalyst” for the next quarter, with the Fed’s stance on rate cuts serving as “the definitive watershed for either a powerful rebound or a further breakdown,” Ryan Yoon, senior analyst at Tiger Research, told Decrypt.
On prediction market Myriad, owned by Decrypt’s parent company Dastan, users put just a 5% chance on the Fed cutting rates by more than 25bps in the first half of the year. Myriad users are also pessimistic about the Iran conflict, with the chances of a U.S./Iran ceasefire before June plunging from 58% at the start of the week to 39% today, while the chances of U.S. boots on the ground before May have jumped from 57% to 87% in the same timeframe.
A “growing regional divergence” in markets such as Iran, where access to global financial systems remains “constrained,” could also shape Bitcoin’s trajectory, Markus Levin, co-founder of decentralized data network XYO, told Decrypt.
“Bitcoin usage has historically increased during periods of economic pressure and is likely to rise again if the conflict persists,” he said. “That demand will not offset global macro forces in the short term, but over time it can push Bitcoin toward behaving more like a neutral reserve asset, closer to gold.”
Bitcoin was trading at around $66,830 at press time, flat on the day, according to CoinGecko data.
Daily Debrief Newsletter
Start every day with the top news stories right now, plus original features, a podcast, videos and more.
On June 25, 2021, Elon Musk posted that his new Shiba Inu puppy would be named Floki. Within hours, people had already created a token named after the dog. Not the dog himself — the promise of the dog. The token launched before the actual puppy had even arrived at Musk’s house.
That’s the origin story. And while it sounds ridiculous — because it is — what happened next wasn’t. A community formed, took over the project, started building actual products, and turned what should have been a 48-hour meme into a token that still trades with a $270 million market cap in April 2026.
$FLOKI’s all-time high was $0.0003462 on June 5, 2024. The current price is around $0.000029. That puts the token roughly 91% below its peak, which sounds painful, but it’s worth knowing that $FLOKI hit a higher $ATH in 2024 than it did in the 2021 bull market — a fact most price prediction articles get wrong because they use the 2021 figures without checking. The 2021 high was around $0.0003437. Close, but the actual peak came three years later.
Both numbers feel very far away from $0.000029.
Disclaimer: This article is informational only. Nothing here is investment advice. Meme coins are highly volatile. Do your own research.
What $FLOKI Actually Is in 2026
The official $FLOKI pitch has evolved significantly since the Musk tweet era. The team — known as the Floki Vikings — calls it “the people’s crypto” and has spent four years building an ecosystem around the token that goes well beyond meme coin territory.
Valhalla is the centrepiece. Launched on opBNB mainnet on June 30, 2025, it’s a browser-based play-to-earn MMORPG with hex-grid combat, $NFT characters called Veras, and an in-game economy backed by a multi-million dollar treasury. Over a million transactions and 125,000 NFTs minted since mainnet launch. A Chinese version is in development. Mobile access is planned for late 2026. These aren’t vaporware announcements — the game exists and people are playing it.
TokenFi is the RWA tokenization platform. Built by the Floki team, governed by the Floki DAO, but powered by its own separate token ($TOKEN). This distinction matters: TokenFi’s success doesn’t automatically flow into $FLOKI price. However, it does build the broader ecosystem and marketing reach.
The $FLOKI Trading Bot (Telegram/Discord) routes 50% of its fees directly to buy-and-burn. That’s real market demand creating real deflationary pressure — modest, but genuine.
Staking is live: around 460,000 holders have staked over $283 million worth of $FLOKI to earn TOKEN rewards.
On the regulatory front, $FLOKI became the first crypto project to file a MiCAR-compliant white paper with the European Securities and Markets Authority — submitted via $LCX, a licensed EU exchange. That gives $FLOKI legal trading status across compliant EU platforms, which matters more than most meme coin investors currently appreciate.
$FLOKI is dual-chain — available on both Ethereum (ERC-20) and Binance Smart Chain (BEP-20). The contract addresses are well-documented and have never changed.
Is $FLOKI available on major exchanges? Yes. $FLOKI trades on Binance, Coinbase, Kraken, Bybit, OKX, Bitget, KuCoin, and many others. It’s one of the more accessible meme coins for retail buyers. The dual-chain deployment on Ethereum and BSC also means it’s available on Uniswap, PancakeSwap, and most major DEXs.
The Token Mechanics
Total supply: 10 trillion $FLOKI. About 9.54 trillion are in circulation.
$FLOKI has a transaction tax that takes 0.3% on every buy or sell. Half of that goes to holders (including the burn wallet), which creates ongoing deflation. As the burn wallet accumulates more $FLOKI over time, it earns more from subsequent transaction taxes, accelerating the burn rate. It’s a compounding mechanism — slow, but structurally present.
The burn wallet currently holds a significant portion of the supply. Every trade helps reduce what’s left in circulation. This isn’t going to single-handedly send $FLOKI to new highs, but it’s a mechanical support that many purely speculative meme coins don’t have.
What actually drives $FLOKI’s price is demand. Whether that demand comes from Valhalla players needing $FLOKI for in-game activity, traders rotating into meme coins during speculative cycles, or new exchange listings — the burn mechanics help but don’t do the heavy lifting alone.
$FLOKI Key Data (April 2026)
Source: CoinGecko
What Went Wrong Since the $ATH
The June 2024 peak was a product of the broader meme coin supercycle that swept through the first half of that year. Dogecoin, Shiba Inu, PEPE, BONK, and WIF all had significant runs in that window. $FLOKI rode that wave to its all-time high.
Then the cycle ended. By late 2024, meme coins across the board had given back most of their gains. Bitcoin made new highs in late 2024 and early 2025; altcoins and meme coins largely didn’t follow. $FLOKI fell from $0.000346 in June 2024 to $0.000027 by February 2026 — a 92% decline that left most holders who bought during the peak significantly underwater.
The broader crypto bear market through late 2025 and into 2026 didn’t help. Fear and Greed Index hitting extreme fear levels for extended stretches, macro uncertainty, and capital consolidating into Bitcoin specifically all worked against altcoins and meme coins in particular.
What makes $FLOKI’s situation complicated is that its fundamentals actually improved during this period. Valhalla launched. MiCAR was filed. Staking TVL grew. The ecosystem built real products while the price fell. The token trades at 91% below its high despite the project being demonstrably more built out than it was when it set that high.
$FLOKI Price Prediction 2026
$FLOKI at $0.000029 is hovering near multi-year lows. Most analyst models were built when the token was higher, which means their 2026 ranges often start above where the token currently trades.
CoinCodex projects $0.00002831–$0.00005154 for 2026. The lower bound is essentially current price; the upper would be a modest 1.8x. Changelly sees an average of around $0.0000654, which is a 2.3x from here. Cryptopolitan models a range of $0.00003002–$0.0000983 — the upper end would be roughly a 3.4x from current prices.
The bull models diverge more sharply. CoinLore’s algorithm puts the 2026 max at $0.000983 — a 34x, which would require either a full meme coin supercycle revival or a Valhalla-driven user adoption story that’s hard to predict. CoinPedia’s range of $0.000250–$0.000820 for 2026 sits between the conservative and extreme cases.
What would a realistic recovery look like? Getting back to $0.00006–$0.00010 — roughly 2–3.5x from current prices — is achievable if the broader crypto market stabilises and meme coin rotation returns. That price range is where $FLOKI traded in Q3 2025 before the selloff accelerated. It’s not spectacular, but it’s where genuine buyers previously showed up.
Getting back toward $0.0001 and beyond requires more than macro recovery. It requires Valhalla’s mobile launch to drive new user adoption, the MiCAR compliance to actually translate into European exchange listings and institutional buying, and the trading bot fee burns to compound meaningfully.
$FLOKI Price Prediction 2027
By 2027, $FLOKI’s price thesis rests on whether Valhalla becomes a game people actually play in meaningful numbers — not just blockchain enthusiasts but casual gamers who happen to use the token. The mobile launch planned for late 2026 is the catalyst that matters most. GameFi projects that succeeded beyond crypto-native audiences did so overwhelmingly through mobile accessibility; the browser-based version is fine but mobile is where scale comes from.
TokenFi’s RWA tokenization platform could also drive $FLOKI demand indirectly through ecosystem visibility and Floki DAO governance activity, even if TokenFi itself runs on $TOKEN. The broader RWA trend — where blockchainreporter.net has covered projections toward $18.9 trillion by 2033 — gives TokenFi a credible market to operate in.
Changelly models an average of around $0.0000959 for 2027. DigitalCoinPrice targets up to $0.000147. CoinPedia’s bull range of $0.000600–$0.00100 would put $FLOKI back in territory it briefly occupied during the 2024 $ATH run.
The technical setup that would trigger a 2027 recovery: sustained close above $0.000045 (first major resistance), then a break of $0.000065 with volume. From there the path to $0.0001 opens up. None of that happens without broader market conditions cooperating.
$FLOKI Price Prediction 2030
The 2030 case for $FLOKI is actually one of the more grounded meme coin long-term theses, and not because the numbers are exciting — they’re not — but because the arguments aren’t purely speculative.
Valhalla, if it’s still operating in 2030 with a real player base, creates ongoing $FLOKI demand that isn’t dependent on meme cycles. The burn mechanism compounds over time. The staking rewards system retains holders. And $FLOKI is one of only a handful of projects from the 2021 meme coin wave that is still actively building in 2026 — the Floki team themselves made this point in a 2025 AMA, noting that $FLOKI is nearly 4.5 years old and one of the only relevant projects from that cycle beyond $DOGE and $SHIB.
Changelly’s 2030 average of $0.000318 — roughly an 11x from current prices — reflects a scenario where the project survives, the ecosystem grows steadily, and meme coin cycles contribute tailwinds. Not life-changing, but real.
CoinPedia’s $0.00153–$0.00263 range for 2030 would require $FLOKI to reclaim and surpass its $ATH — plausible if Valhalla reaches the scale of a mainstream mobile game and RWA tokenization through TokenFi drives ecosystem interest.
WalletInvestor and TradingBeasts both see sub-$0.00005 through 2030, essentially flat from today. That scenario means the ecosystem products fail to retain users and $FLOKI fades into the background as newer meme coins capture each subsequent cycle.
The honest answer: somewhere in the $0.0001–$0.0004 range by 2030 is a reasonable base case if the project continues building. That’s 3–14x from here. The variance is enormous because 2030 meme coin prices depend on factors nobody can model in 2026.
Can $FLOKI Surpass Its $ATH?
That’s the headline question and the honest answer is: yes, but not easily, and probably not in 2026.
The 2024 $ATH of $0.0003462 sits 12x above current prices. A 12x on a token with a $270 million market cap would put the market cap at roughly $3.2 billion — not unreasonable for a top-tier meme coin during a supercycle. $DOGE and $SHIB both carry far larger market caps in strong markets.
What would have to happen: a meme coin supercycle comparable to 2021 or the first half of 2024, Valhalla demonstrating real mobile user growth, the trading bot burn accumulating enough pressure to matter at scale, and the MiCAR compliance driving meaningful European buying. That’s not an impossible combination. It’s just one that requires everything to go right simultaneously.
$FLOKI is a better-positioned bet for $ATH recovery than most meme coins because it’s still being built by people who clearly intend to keep building. The community is still intact after nearly five years. The ecosystem products are real.
But “better than most meme coins” is a low bar. Whether $FLOKI specifically reclaims $0.000346 depends more on when the next meme coin season arrives and how loud $FLOKI’s community is when it does than on anything the team builds between now and then.
That’s just what meme coin investing is.
Technical Levels
Current price is near the 2026 low of around $0.000026–$0.000028 from February. The first meaningful support floor is in the $0.000020–$0.000025 range — losing that would be notable.
On the upside, $0.000045 is the first major resistance. The 200-day moving average has been declining since August 2025, meaning any recovery faces structural overhead. $0.000065 is the level that would indicate genuine trend reversal. $0.000095–$0.0001 represents the territory $FLOKI held through Q3 2025 before the selloff.