
Bitcoin is holding key breakout areas as two charts point to a possible move toward $80,000. However, $BTC needs to defend support and break short term resistance to confirm the setup.
Bitcoin Forms Bull Flag as $80K Breakout Comes Into Focus
$BTC trades near $77,800 on the 1 hour chart, while the structure shows a possible bull flag formation. The pattern follows a strong upward move, then shifts into a tight consolidation under resistance.
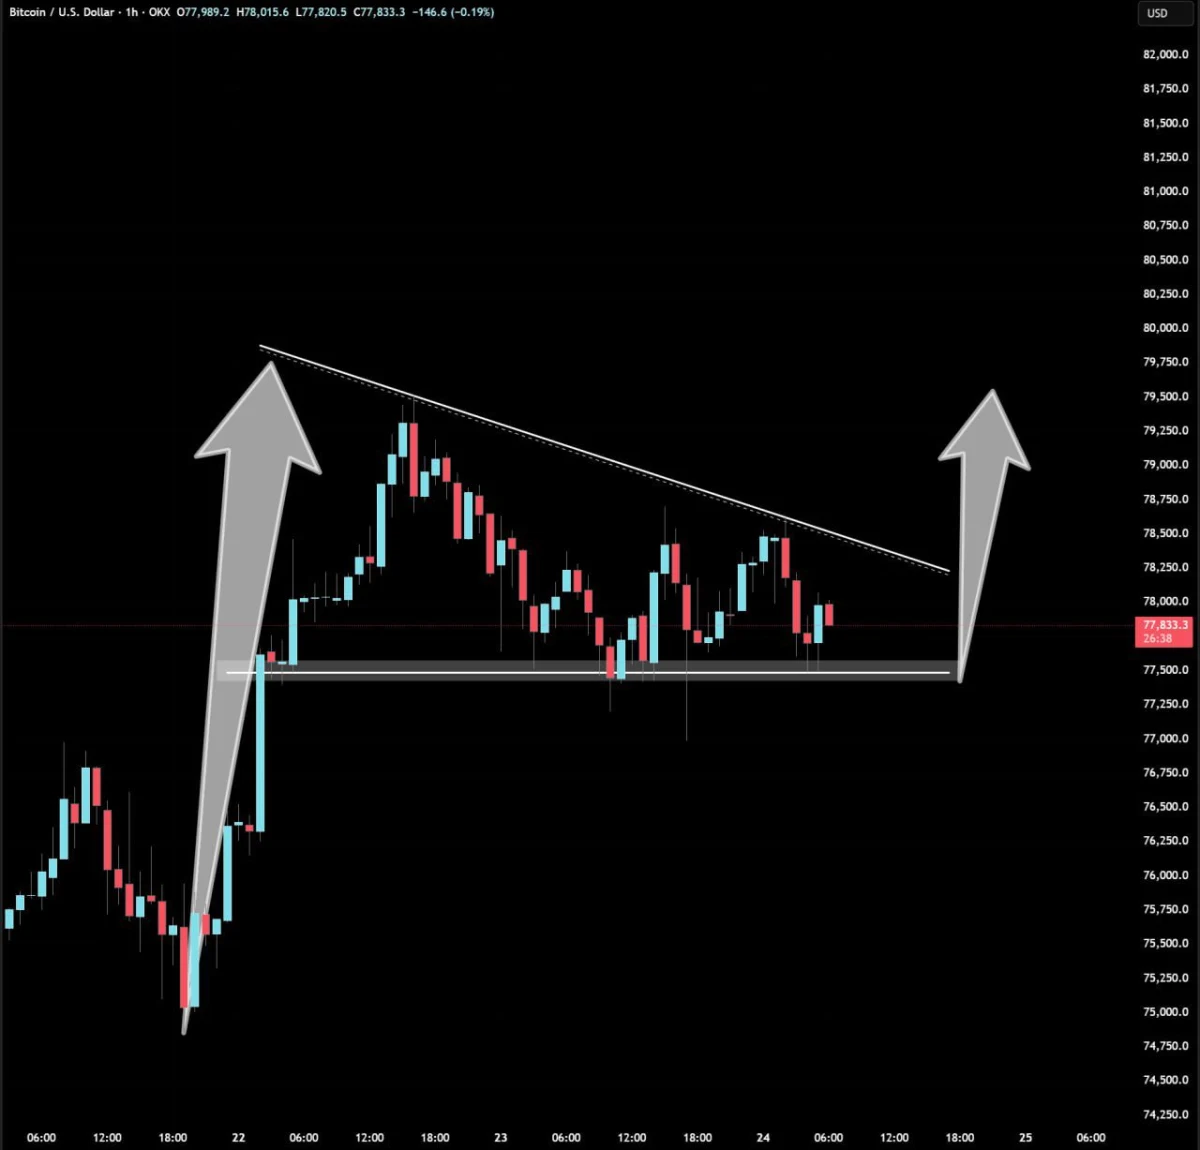
BTCUSD 1H Bull Flag Setup. Source: Elja via TradingView
A bull flag usually forms when price pauses after a sharp rally, then prepares for a continuation move if buyers regain control . Here, $BTC holds support near $77,500, while lower highs create a descending resistance line.
If price breaks above that trendline, $BTC could move toward the $79,500 to $80,000 zone. That level also matches the projected move shown on the chart.
However, the setup depends on holding support. A breakdown below $77,500 would weaken the pattern and delay the upside continuation.
Overall, the chart shows consolidation inside a bullish structure, but $BTC needs a breakout to confirm the move.
Bitcoin Retests Channel Breakout as $80K Zone Comes Into Focus
Bitcoin is retesting a breakout from its rising channel after moving above the long descending trendline. The chart shows price holding near the breakout area, which now acts as a key test for buyers.
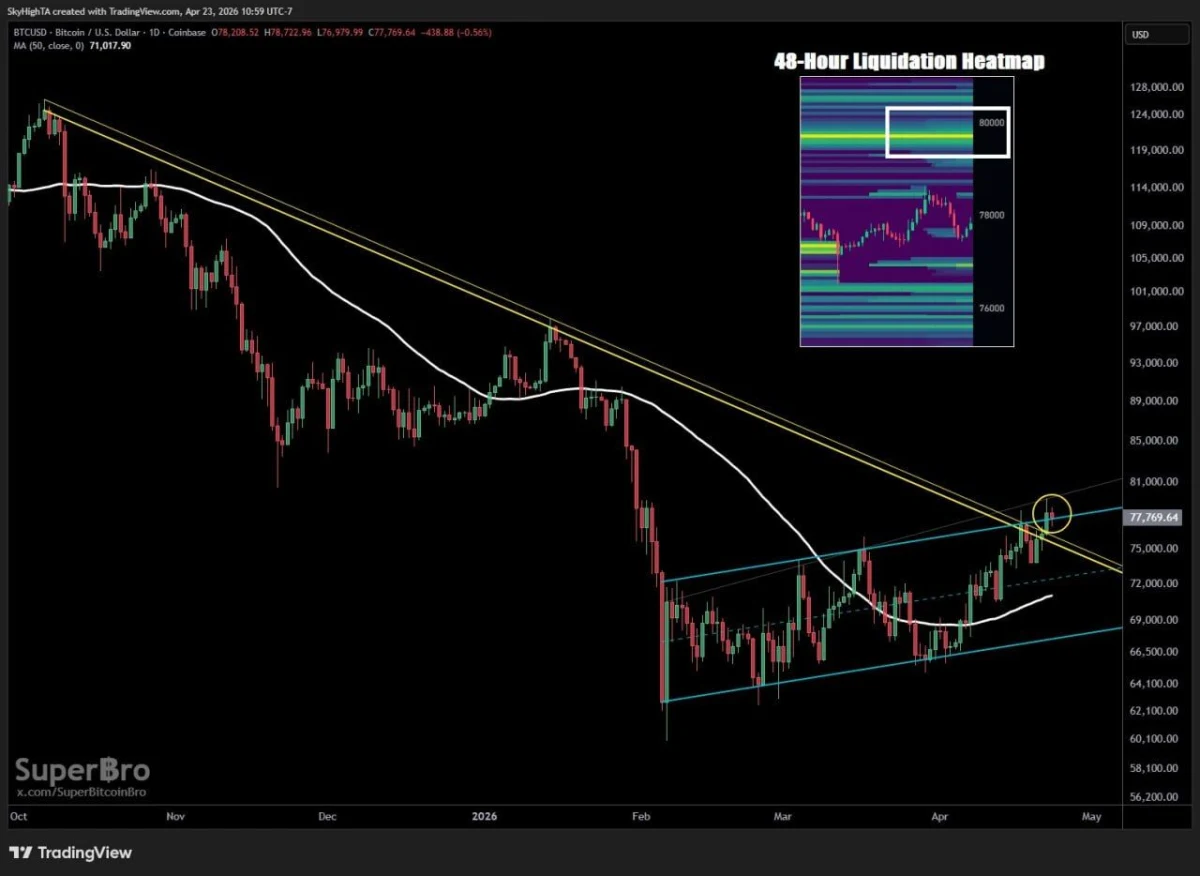
BTCUSD Daily Channel Breakout Retest. Source: SuperBitcoinBro
The 50 day moving average sits below price, adding another support layer near the channel’s lower range. As long as $BTC holds above the breakout zone, the structure keeps the move toward $80,000+ in focus.
The liquidation heatmap also shows activity near the $80,000 area. That makes the level important because price often moves toward zones with heavy liquidity.
However, a failed retest would weaken the setup. If $BTC drops back below the descending trendline and channel support, the breakout would lose strength.
Leave a Reply