The rising trendline sits right where the 200-day EMA at $1.3683 and the 50-day EMA at $1.3605 cluster, which makes $1.37 a stronger floor than any single indicator would be alone. $XRP has about $0.11 of cushion above it, and it still trades above the 20-day EMA at $1.4515, with the Parabolic SAR at $1.4157 below price keeping the short-term trend bullish for now.
Related: Pi Network Price Prediction: Protocol 28 Sets October Upgrade Deadline as PI Trades Near $0.089
$XRP Support and Resistance Levels
$XRP News: Peter Brandt Says the Charts Alone Justify Owning $XRP
you are bit late to this one Peter https://t.co/cJPX21cPTV
— Ali Charts (@alicharts) September 27, 2026
Veteran trader Peter Brandt said owning $XRP doesn’t require being a “certified cult member,” arguing the charts are reason enough to hold a position. The $5.40 projection attached to his comments is the same long-term chart he posted last week, so it isn’t new, and he repeated that publishing a chart is not the same as holding a trade.
Two other analysts pointed to the same price area:
- Ali Martinez flagged an inverse head and shoulders pattern with a neckline near $1.55, where a confirmed breakout could push $XRP toward $2, roughly 30% higher
- Dark Defender called a parabolic move inevitable soon
$XRP has since slipped below that neckline area, trading near $1.48 against the roughly $1.52 cited in the report.
$XRP Derivatives: Longs Take the Hit as Trading Volume Jumps
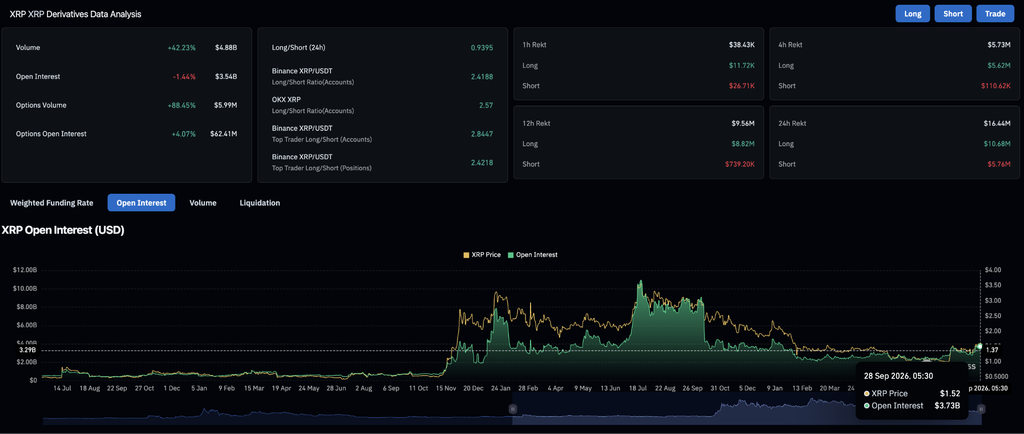
$XRP derivatives volume jumped 42.23% to $4.88 billion over the past 24 hours, while open interest, the total value of open bets, slipped 1.44% to $3.54 billion. More trading alongside fewer open positions points to traders being forced out rather than adding new bets.
Related: Pump.fun Price Prediction: PUMP Gains 17% as Buying Activity Strengthens
Longs took the bigger hit, with traders betting on higher prices losing $10.68 million against $5.76 million for those betting on lower prices, and nearly all of the last four hours’ $5.73 million came from longs. The crowd still leans bullish overall, with Binance showing 2.42 long accounts for every short account.
$XRP ETF Flows: An 11th Straight Week of Inflows Pushes Cumulative Total to $1.79 Billion
US spot $XRP ETFs added $22.65 million on September 25, capping a $75.59 million week that marked the 11th consecutive week of inflows and the largest weekly total since $110.49 million in late August. Cumulative net inflows stand at $1.79 billion, with total net assets at $1.77 billion.
Bitwise’s $XRP fund led Friday’s inflow at $18.39 million and remains the largest fund by net assets at $647.83 million, while Franklin’s XRPZ added $4.26 million and the other three funds were flat. 21Shares’ TOXR is still the only fund net negative since launch, down $21.15 million.
$XRP Exchange Flows: More Coins Leave Exchanges Than Arrive
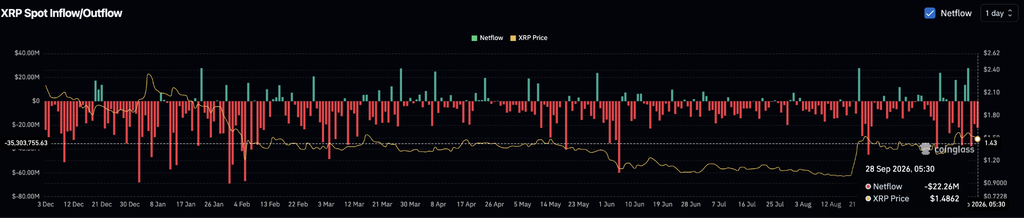
$XRP’s spot netflow reads -$22.26 million so far today, meaning more coins left exchanges than arrived, which is typically read as holders moving $XRP off trading venues rather than lining it up to sell.
This tracks coins moving on and off exchanges, a separate measure from the ETF flows above.
$XRP Price Prediction: Bullish and Bearish Scenarios
Bullish Case, Target: $1.64 (Upper Triangle Trendline)
$XRP holds the 20-day EMA at $1.4515 and reclaims the $1.55 neckline area analysts are watching. A confirmed break would put the triangle’s upper trendline near $1.64 in reach, and the $2 target cited by Ali Charts would need that trendline to clear first.
Bearish Case, Risk Level: $1.37 (200-Day EMA)
$XRP loses the 20-day EMA and the Parabolic SAR at $1.4157. More long liquidations would fit that scenario, exposing $1.3683, where the rising triangle trendline, the 200-day EMA, and the 50-day EMA at $1.3605 all meet, and a close below that would break the triangle’s lower boundary.
Related: Quant Price Prediction: QNT Surges Nearly 300% as Clearing House Selects Quant for Tokenized Deposit Network
FAQs
$XRP could extend toward $1.55 and then the triangle’s upper trendline near $1.64 if it holds above the 20-day EMA at $1.4515. Losing that level risks a slide toward $1.3683, where the 200-day EMA and the triangle’s rising support meet.
It would need to clear roughly $1.55 first, the neckline of an inverse head and shoulders pattern flagged by analyst Ali Charts, who says a confirmed breakout could carry price toward $2. $XRP is trading below that neckline now, so it remains a scenario rather than a forecast.
Peter Brandt’s long-term chart implies an eventual advance to $5.40, but he described it as a projection rather than an active trade, and it reflects a decade of price structure rather than a near-term target.
Yes. US spot $XRP ETFs logged an 11th consecutive week of inflows, adding $75.59 million last week and bringing cumulative net inflows to $1.79 billion. Two things to check: the triangle trendline values ($1.64 upper, $1.37 lower) are read off the chart by eye, and BeInCrypto’s $1.52 is older than the chart’s $1.4793, so I used the chart price.
Leave a Reply