
Bitcoin [$BTC] is up 0.53% in the past 24 hours but trades in a 3% drawdown over the past seven days. The cryptocurrency has struggled to reclaim its initial strength that took it above $80K in mid-May.
In fact, a couple of metrics show that Bitcoin price is more likely to drop than reclaim higher levels. However, this prediction is not certain, but when many indicators rhyme, such moves tend to align.
Liquidation data suggest more decline
For instance, the liquidation data from the 30 major exchanges over the past month show a cluster of orders at $57,300. This zone rests well below the current levels.
Worth noting, there is another massive liquidation cluster at $70K, which is a bit far compared to the $57.3K level.
Since price tends to follow liquidity in close proximity, $BTC may drop to $57.3K. However, for such to happen, $BTC has to lose more strength.
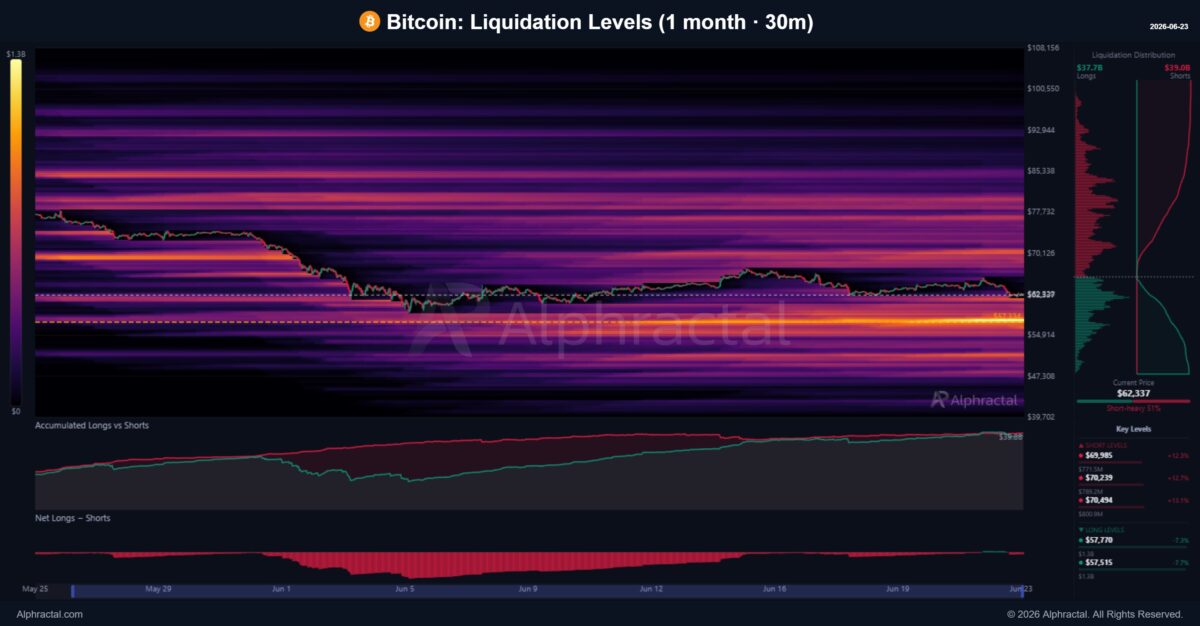
Of the cluster below current price action, the lowest significant cluster is at $47,300, which is also a possibility.
What’s reinforcing $BTC’s drop?
Apart from the liquidity magnet resting below, Bitcoin has broken below the Rainbow Chart for the second time in history.
Since inception, $BTC has traded with the Rainbow Chart channel, but in 2022, it breached the support, hitting $15,500. Now, it is up about 4x from this bottom but again below it at $62,000.
This indicates the crypto is experiencing weakness, but $62K feels different from $15.5K. In 2022, $BTC went low but later ripped as bulls bought the dip.
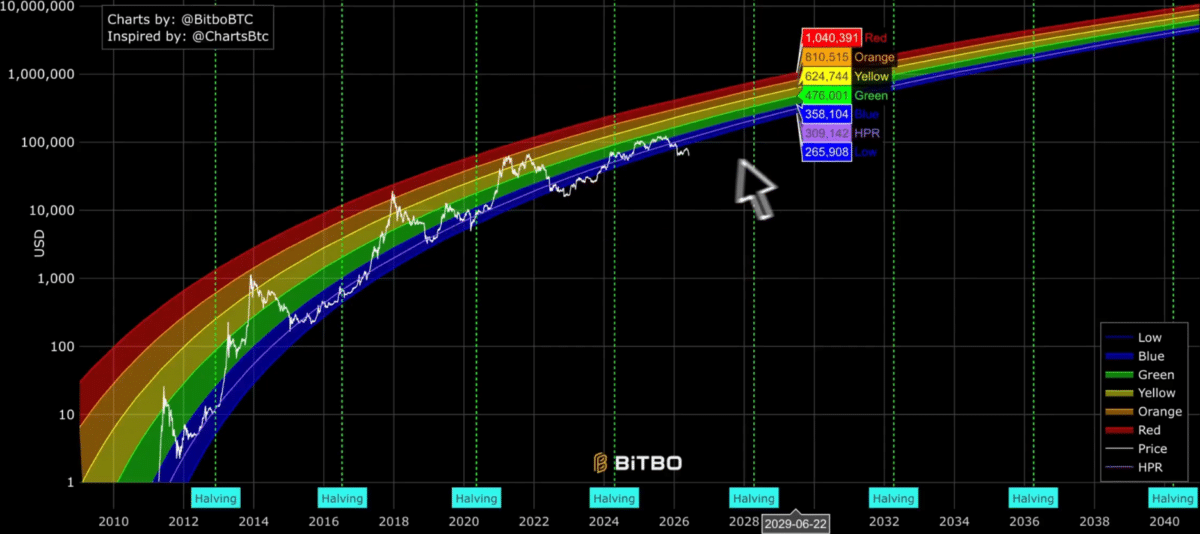
As such, it could suggest that $BTC may also dip again lower if history were to rhyme. Still, some participants argue that Bitcoin models are no longer suitable for decision-making.
Are another two or more months of weakness coming?
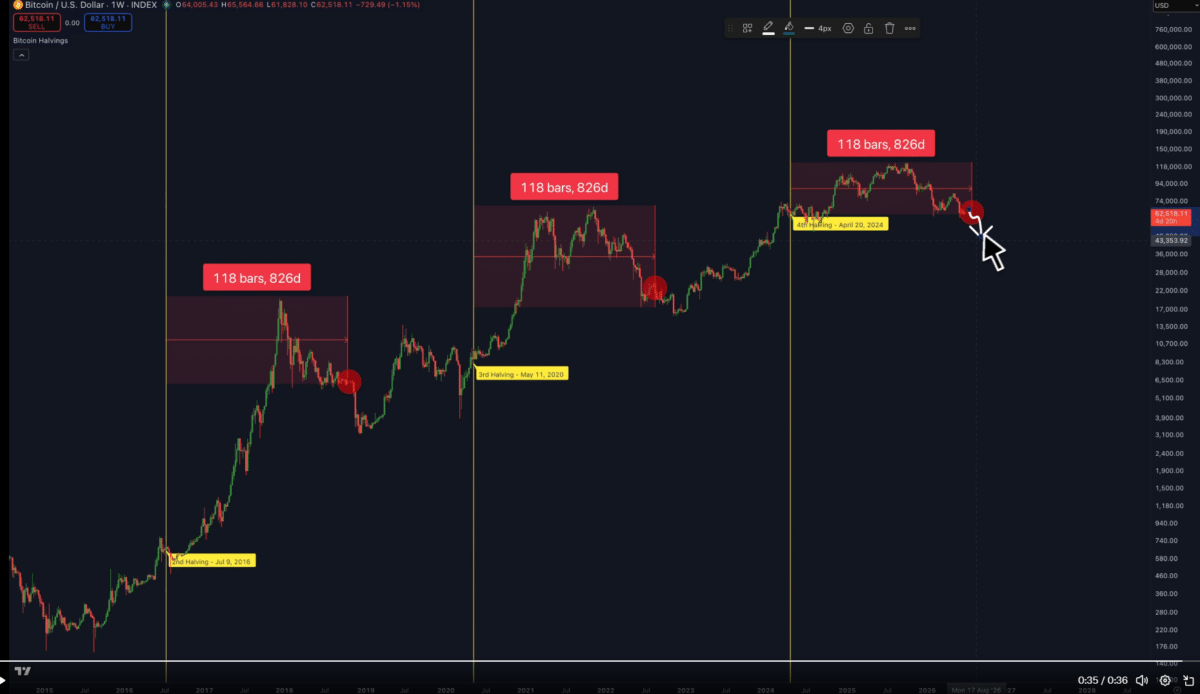
Finally, another interesting phenomenon shows $BTC might continue dipping. Historically, around 826 days after each halving has marked the final capitulation into the bear market bottom. This dates into late July.
After that capitulation, it has taken between 70 and 110 days to establish a major low. This lines up to around October or November, suggesting the decline might stay until then.
Even major institutions like BlackRock are anticipating that decline. For instance, they deposited 2,400 $BTC worth about $150 million and 38,337 ETH valued at $63 million into Coinbase, potentially to sell. Onchain analysts suggest more could be on the way.
With that in mind, more of a downtrend for $BTC is anticipated at least for now. However, markets are usually uncertain, and anything could happen in between these timelines and change the script.
Final Summary
- Bitcoin liquidation heatmaps suggest more price decline could be looming, reinforced by the breakdown of the Rainbow channel.
- Historical data shows $BTC may continue dipping until late July, but a major low is anticipated in October/November as institutions continue selling.
Leave a Reply