The 200-week moving average stands out as one of the technical indicators used to assess long-term price trends in the Bitcoin market. Based on the average of prices over the past 200 weeks, the indicator helps track the asset’s position within the long-term market trend.
Cole also emphasized that he is quite optimistic about Bitcoin. The $500,000 price level he mentioned for 2030 is a prediction reflecting his long-term expectations rather than current market conditions.
Whether Bitcoin reaches this level will depend on numerous factors, including market demand, institutional adoption, macroeconomic conditions, liquidity, and regulatory developments. Cole’s statements indicate that long-term bullish expectations for Bitcoin remain on the agenda among institutional market participants.
This structure will eliminate the need for businesses to create cryptocurrency wallets, manage private keys, or hold stablecoins on their balance sheets. From the company’s perspective, the transaction will be settled in traditional currency, while the payer will be able to use stablecoins. Thus, the speed of blockchain-based payments will be combined with the accounting and consensus infrastructure of the classic banking system in a single transaction.
Coinbase plans to offer virtual accounts through its infrastructure model as a banking service. Users will be able to automatically convert their fiat currency into stablecoins in these accounts. The collaboration will initially launch in the US.
Companies say the service is particularly geared towards corporate clients operating in different countries who want to receive payments around the clock. While stablecoin transfers can be made outside of bank operating hours, regulatory checks, customer verification, and final banking settlement of the funds will remain part of the system.
The partnership doesn’t directly mean a new stablecoin will be launched. Citi and Coinbase are connecting payment channels that use existing stablecoins. The tokens to be used, fees, transaction limits, and all supported countries have not yet been announced.
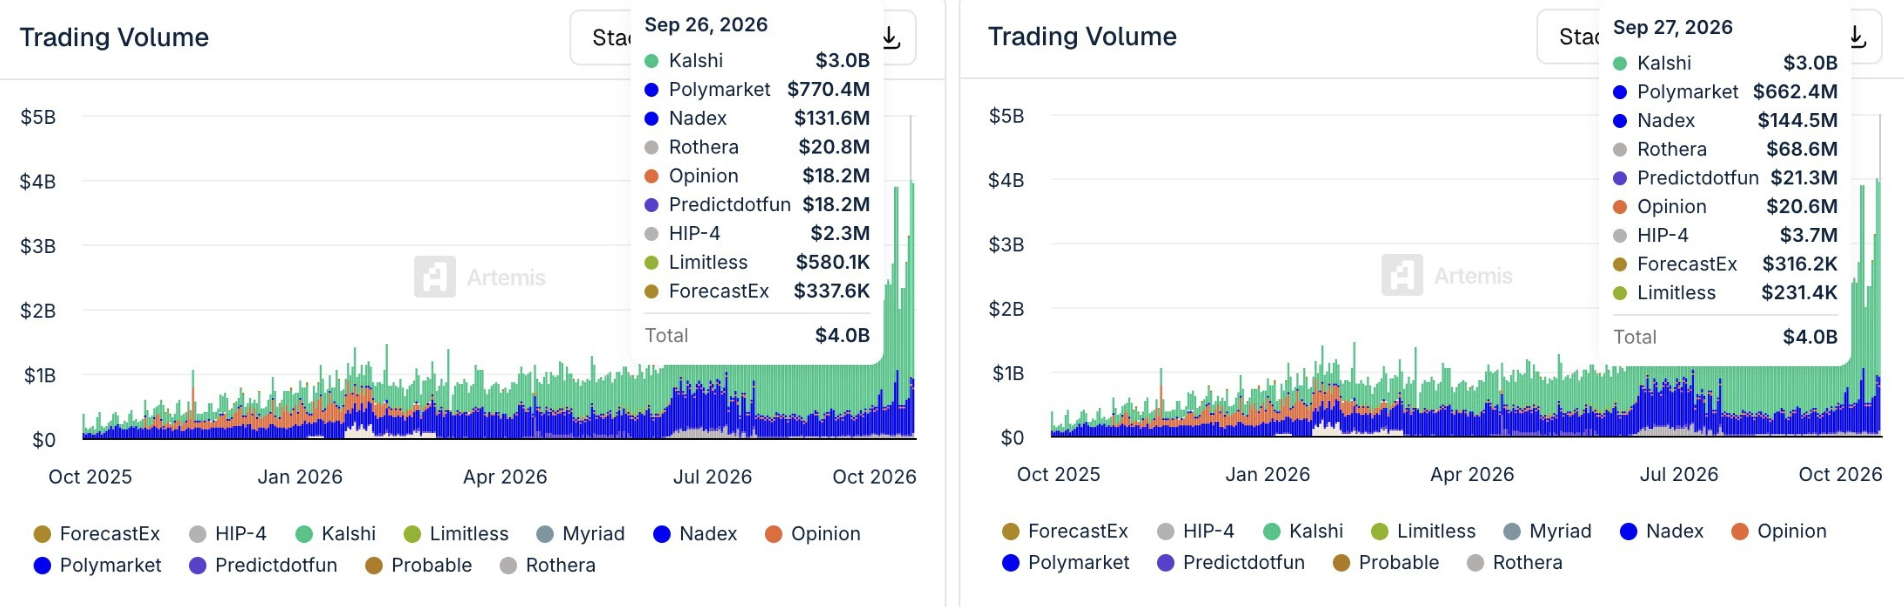
Kalshi registered around 77% of all the volume tracked from last week, with $15.8 billion. Polymarket came in a distant second with $3.6 billion. Nadex followed with $481.9 million and Rothera with $272.3 million, while Predict.fun and Opinion each cleared $120 million.
Polymarket had a decent weekend of its own, with $770.4 million on Saturday and $662.4 million on Sunday. However, Kalshi’s growth through September has been much faster and the gap between the two platforms is now the widest it has been all year.
American Football Pushed the Biggest Days to the Weekend
With September coming to a close, the sector’s trading volume over the course of the month has already broken past the previous highs set in July. These records have arrived just as the NFL and college football season in the US got underway. Most games are played over the weekend, hence why most of the sports trading is piling up during this period.
A large share of that flow runs through parlay-style combo contracts. A parlay bundles several outcomes into one bet. A trader might back three teams to win on the same Sunday afternoon, for example. The contract pays out only if every leg hits, so the odds are long and each contract often costs just a few cents.
That low price is where headline volume gets inflated. Kalshi counts every contract at its $1 payout value rather than what the trader paid. A $20 bet on a long-shot parlay priced at 5 cents buys 400 contracts, which shows up as $400 in volume. When thousands of those bets land on a busy football weekend, the dollar figures climb much faster than the money at risk.
The Fed, Crypto and the Midterms Added to the Total
Sports didn’t carry the whole week. The Federal Reserve’s September rate decision drew steady positioning on both Kalshi and Polymarket. Short-duration crypto markets, which ask whether Bitcoin or Ether will close above a set price within hours or by the end of the day, turned over repeatedly as prices moved.
Traders have also started positioning early for the Nov. 3 U.S. midterm elections, with control of both chambers of Congress at stake. Election contracts drove the last big volume cycle in 2024, and the midterms are now five weeks away. The NFL regular season runs into early January.
This suggested that the CVD had expanded by $430 million within that period. Binance traders’ activity also fed into the CVD, as exchange volume moved from -$1.0 billion to roughly -$1.2 billion. Within that period, the price has returned roughly 5.00% in value.
Spot accumulation helps $XRP absorb selling
One of the major factors that has contributed to the price maintaining an upward motion in the past couple of days against the selling volume in the perpetual market has been Spot investors.
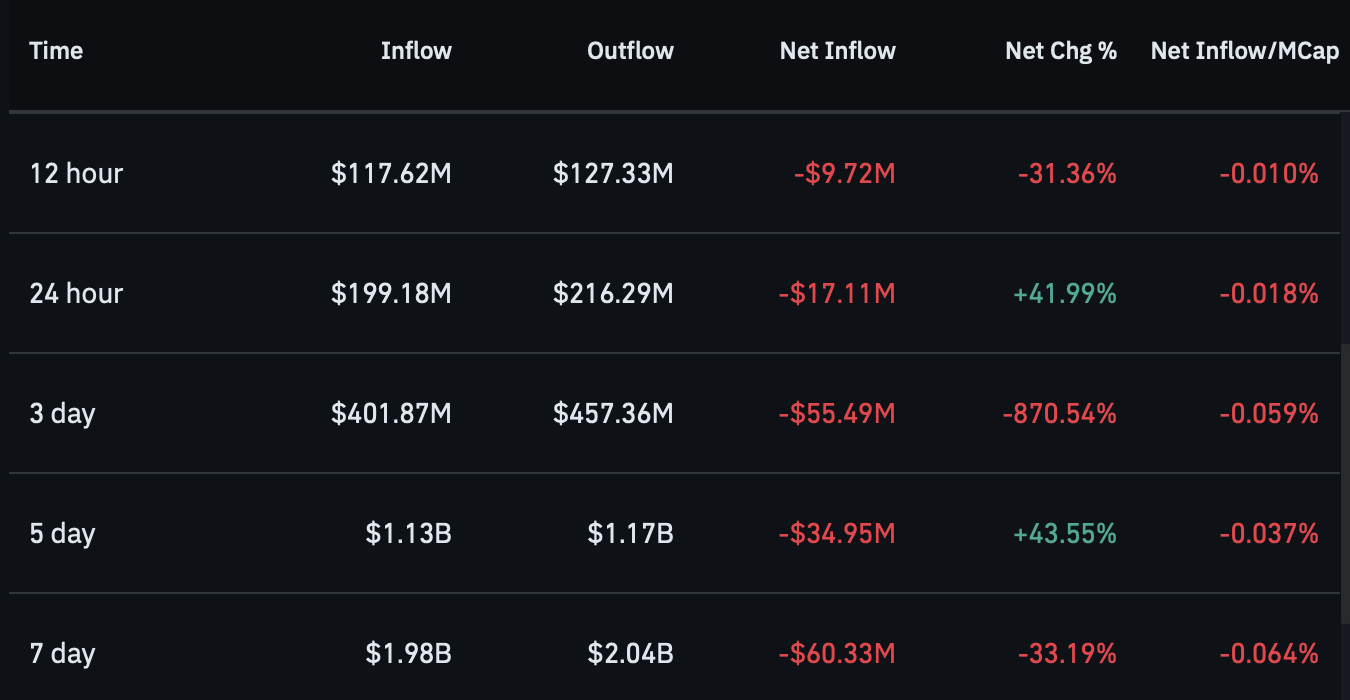
According to CoinGlass, the Spot netflow, which tracks Spot investors’ movement of an asset into and out of exchanges, suggests there’s been more of the latter recently.
More outflow often suggests that investors are moving capital into private wallets for long-term holding.
Source: CoinGlass
In the past 24 hours, that capital has soared to -$17.11 million, and in the last seven days, the figures stood at -$60.33 million.
Continued Spot accumulation against the selling volume helps keep the price intact, as it often absorbs the majority of the selling pressure that comes from the perpetual market.
Positive Funding Rate supports long positions
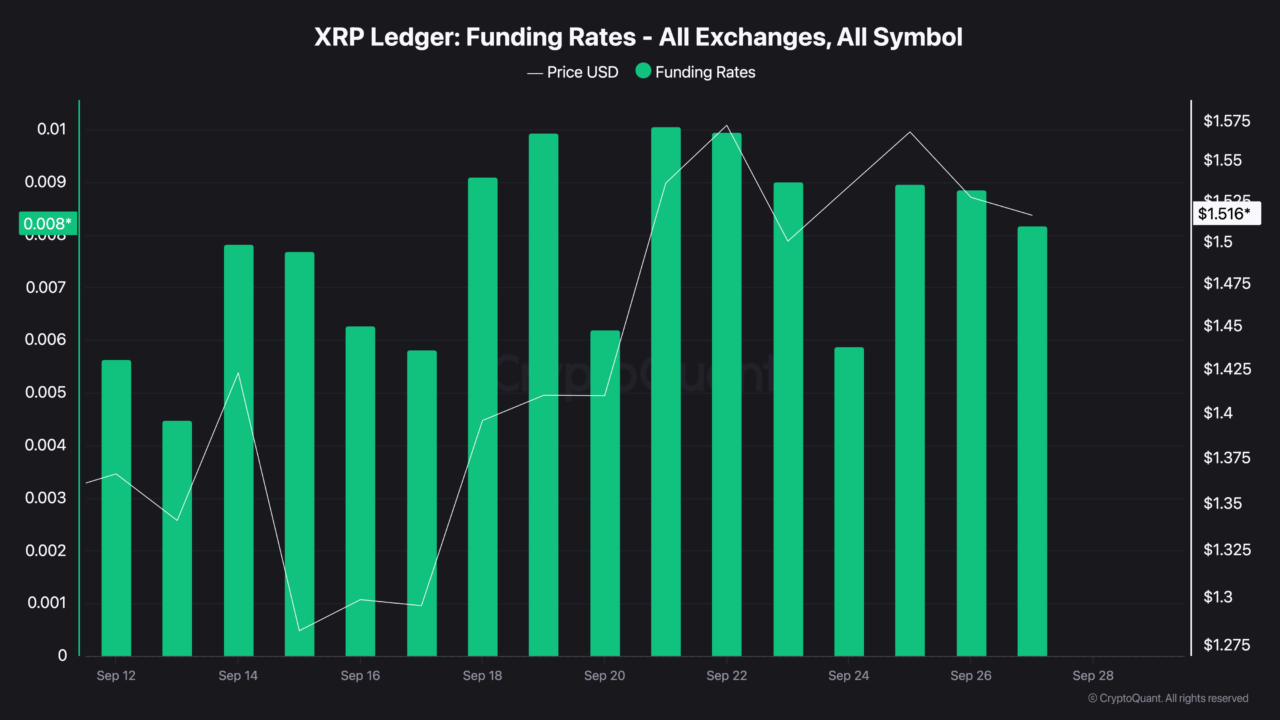
The Funding Rate has been another factor that has helped maintain the price outlook. From the 16th of September to press time, the Funding Rate has stayed positive.
It suggests the majority of the capital in the perpetual market is positioned in favor of a long move, as the Funding Rate within that period grew from 0.0062 to 0.0081.
Source: CryptoQaunt
Overall, $XRP is likely to maintain the bullish outlook if there is continued Spot accumulation alongside the Funding Rate remaining positive without going through an overheating period.
Final Summary
$XRP maintains its upward trend as Spot netflow shows continued accumulation despite persistent selling in the perpetual market.
Positive Funding Rate supports long positioning, but overheating could put $XRP’s bullish outlook at risk.
Revenue grew 12-fold last year to nearly $4.6 billion. Nearly a quarter of it came from just two customers, and the company warned that many of its largest clients are not locked into long-term contracts. Anthropic held $20.28 billion in cash and short-term investments at the end of 2025.
Crypto traders barely reacted
Anthropic pre-IPO perpetual futures, which let traders bet on the company’s valuation before it lists, traded at $1,998 on Tuesday across major exchanges, down about 2% over 24 hours, according to CoinMarketCap. The price remains about 10% below its Sept. 9 record of $2,211.
Each contract’s price tracks Anthropic’s expected valuation in trillions. A price of $1,998, therefore, means traders value the company at about $2 trillion, based on Binance’s pricing. That aligns with Reuters’ figure.
Twelve exchanges list Anthropic pre-IPO perpetuals, according to Coin Metrics. Open interest, or the dollar value of outstanding contracts, stood at over $100 million as of this writing. Binance accounts for over 30% of activity.
On leading decentralized exchange Hyperliquid, the Anthropic market run by Entropy had an open interest of $36 million.
None of these contracts confer any equity stake in Anthropic. They are synthetic derivatives that settle in cash and track the company’s implied valuation, not its share register.
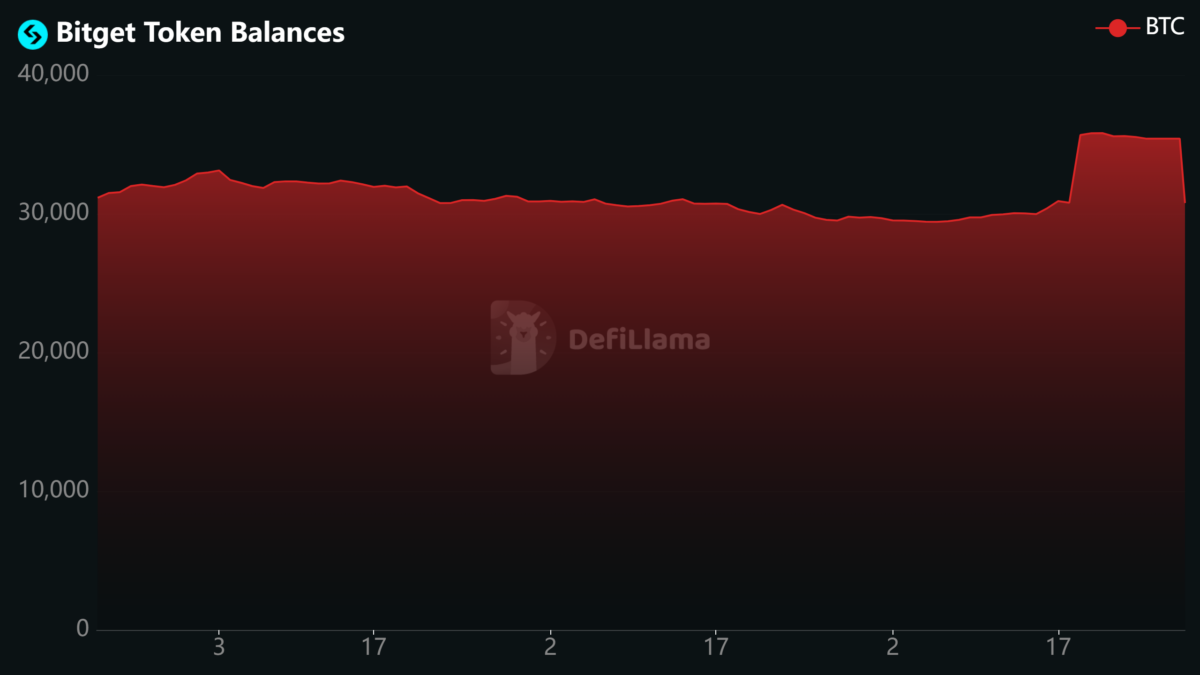
Bitget’s tracked Bitcoin balance hovered near 30,000 $BTC before briefly rising above 35,000 and then declining. Source: DeFiLlama
The reserve decline is larger than the amount Chen said Bitget had processed through customer withdrawal orders. DeFiLlama tracks assets held in wallets attributed to exchanges, meaning changes can also reflect wallet movements or differences in address coverage rather than customer withdrawals alone.
Still, the rapid outflow provides the first indication of how users are responding after Bitget froze withdrawals for four days while investigating the largest security incident in its eight-year history.
Bitget restored Bitcoin withdrawals at 08:00 UTC on Sept. 28 after completing additional checks on its withdrawal infrastructure. Ethereum withdrawals are scheduled to follow on Sept. 29, $USDT on Sept. 30, and remaining tokens, fiat, and peer-to-peer services on Oct. 2.
The restart comes as Bitget attempts to reassure customers that the attack did not compromise its private keys or cold-wallet reserves.
Chen said a completed internal trace found that attackers exploited vulnerabilities in third-party products to obtain internal credentials. Those credentials were then used to submit fraudulent withdrawal instructions that bypassed Bitget’s risk controls.
The exchange has isolated affected systems, revoked and reissued internal credentials, and restructured access to sensitive infrastructure, Chen said. Bitget also disabled the affected third-party functionality while the vendor works on a fix.
Blockchain security firms, including Mandiant and SlowMist, continue to assist with forensic analysis and attempts to trace the stolen assets. Bitget previously said the incident involved a critical backend system in its wallet infrastructure and that it had remediated the vulnerability before withdrawals began returning.
Bitget has said customers will bear no losses from the incident and that its Protection Fund will cover the shortfall. Chen said the company plans to replenish the fund with its own capital to more than $300 million within a week.
Related Reading
Bitget’s hack just got $36 million bigger, and now there’s a bounty on the stolen crypto
Stolen funds move as THORChain resists calls to intervene
Meanwhile, recovering the stolen Bitget funds is becoming more difficult as the assets are fragmented across bridges, cross-chain protocols and privacy services.
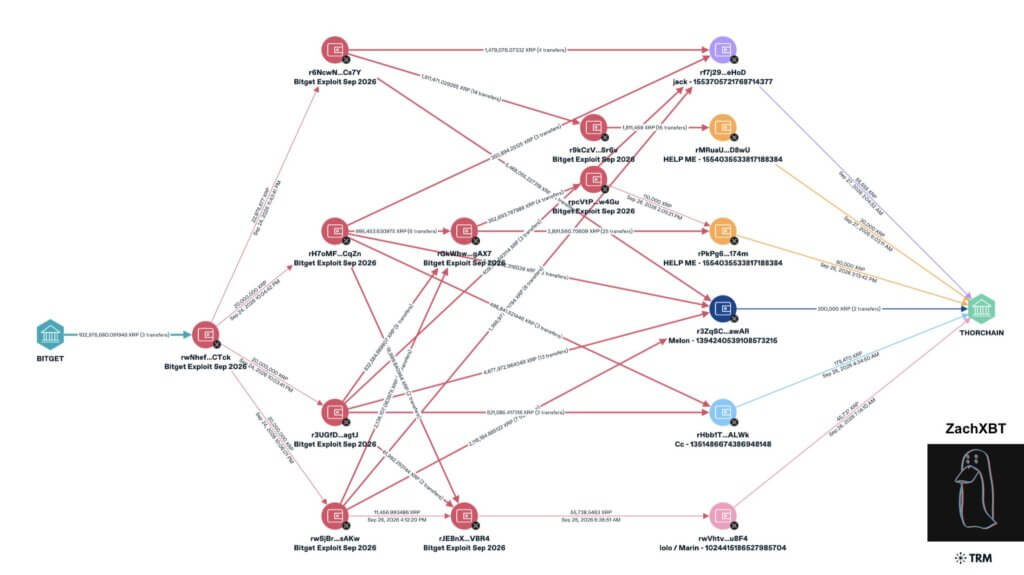
Blockchain investigator ZachXBT said Chinese illicit actors were laundering proceeds from the exploit on behalf of hackers he described as allegedly linked to North Korea. He said the funds were being chain-hopped and deposited into mixing services including Wasabi.
A TRM and ZachXBT flow map traces Bitget exploit funds through multiple intermediary wallets, including transfers toward THORChain. Source: ZachXBT
ZachXBT also linked one participant in the laundering network to movements following the $292 million Kelp DAO exploit earlier this year, saying he had seen similar behavior after several attacks attributed to the TraderTraitor campaign.
The laundering action has put THORChain at the center of a growing dispute over whether permissionless infrastructure should intervene when stolen assets pass through its systems.
THORChain says it would not selectively block wallets or swaps, arguing that its role is comparable to censorship-resistant networks such as Bitcoin and Ethereum. However, blockchain security firm GoPlus challenged that comparison, saying THORChain’s architecture gives its node operators powers that base-layer validators do not have.
GoPlus pointed to THORChain’s threshold-signature vaults, where active nodes jointly authorize outbound transfers, and said releasing assets from those vaults requires an affirmative signing action. It also cited per-chain signing halts, network-wide pauses, and Mimir governance as evidence that node operators can coordinate intervention when they choose.
That makes the argument less about whether THORChain has emergency controls than about when its operators are willing to use them.
GoPlus also pointed to THORChain’s response to its own $10.7 million exploit in May, when the network was halted as part of the containment effort. The security firm argued that the same emergency framework could be used against addresses linked to the Bitget attackers.
THORChain disputes that conclusion, saying a network halt is meant to protect the protocol itself and differs from selectively censoring a particular user, wallet, or swap. It also said attacker addresses were not blacklisted during the May incident, maintaining that the protocol should remain neutral even when known stolen funds move through it.
GoPlus has accused THORChain of benefiting financially from that stance. It estimated that about 101.5 $BTC, worth roughly $8.5 million, had already exited through the protocol from the Bitget exploit, while another 27.63 million XRP, valued at about $43 million, was being converted into Bitcoin.
The firm also cited THORChain’s role in laundering proceeds from the 2025 Bybit hack, when the attacker moved hundreds of thousands of ETH through the protocol and generated millions of dollars in fees. GoPlus argued that the fee income creates an incentive conflict when node operators decline to interfere with illicit flows.
THORChain has not accepted that characterization, and its position leaves the industry with a question of whether decentralized protocols that retain emergency controls should remain transaction-neutral when those same systems are used to launder funds from major hacks.
For Bitget, that debate has immediate consequences. As Ethereum, $USDT, and other withdrawals reopen, investigators are racing to recover assets that are already being broken up across chains and routed through infrastructure whose operators may refuse to stop them.
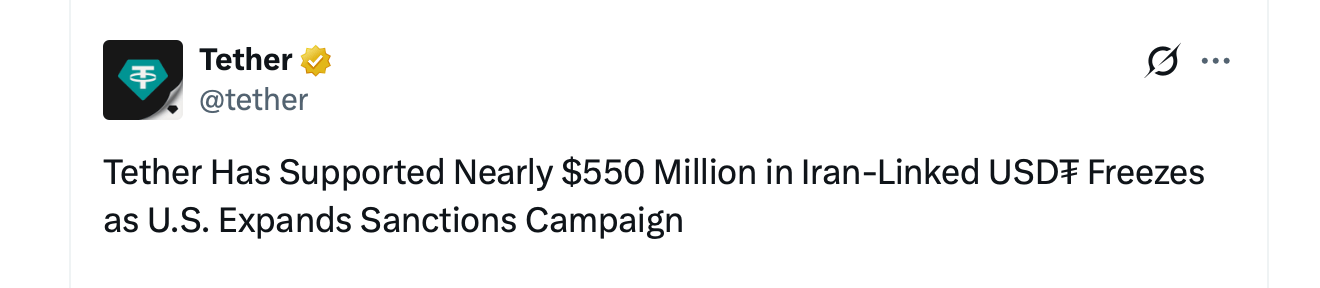
Tether then highlighted several freeze occurrences where the company worked with law enforcement officials to stop illicit flows. Additionally, Tether said it works with Israel’s National Bureau for Counter Terror Financing (NBCTF).
“Together, those actions amount to approximately $550 million in Iran-linked $USDT frozen in 2026 alone,” the company claims.
$USDT Dominates Findings as Tether CEO Rejects Report’s Premise
The subcommittee’s analysis also notes that in addition to $USDT, Iran-based groups are also leveraging bitcoin (BTC), ether (ETH), TRX, and other altcoins. Circle’s $USDC stablecoin was a different story, the report details.
“$USDT’s largest competitor, $USDC—the dollar-pegged stablecoin issued by the second-largest stablecoin issuer Circle—was extremely limited in the Subcommittee’s analysis,” the 24-page study declares.
While the report does discuss bitcoin, other altcoins, and stablecoins, it is largely focused on Tether’s $USDT stablecoin. In the company blog post posted on Monday morning, Tether’s CEO Paolo Ardoino appeared to wholeheartedly disagree with the report’s premise.
“Tether has consistently demonstrated that $USDT is not a haven for sanctioned actors, terrorist organizations or criminal networks,” Ardoino insisted in the Tether blog post.
The rising trendline sits right where the 200-day EMA at $1.3683 and the 50-day EMA at $1.3605 cluster, which makes $1.37 a stronger floor than any single indicator would be alone. $XRP has about $0.11 of cushion above it, and it still trades above the 20-day EMA at $1.4515, with the Parabolic SAR at $1.4157 below price keeping the short-term trend bullish for now.
Related: Pi Network Price Prediction: Protocol 28 Sets October Upgrade Deadline as PI Trades Near $0.089
$XRP Support and Resistance Levels
$XRP News: Peter Brandt Says the Charts Alone Justify Owning $XRP
you are bit late to this one Peter https://t.co/cJPX21cPTV
— Ali Charts (@alicharts) September 27, 2026
Veteran trader Peter Brandt said owning $XRP doesn’t require being a “certified cult member,” arguing the charts are reason enough to hold a position. The $5.40 projection attached to his comments is the same long-term chart he posted last week, so it isn’t new, and he repeated that publishing a chart is not the same as holding a trade.
Two other analysts pointed to the same price area:
Ali Martinez flagged an inverse head and shoulders pattern with a neckline near $1.55, where a confirmed breakout could push $XRP toward $2, roughly 30% higher
Dark Defender called a parabolic move inevitable soon
$XRP has since slipped below that neckline area, trading near $1.48 against the roughly $1.52 cited in the report.
$XRP Derivatives: Longs Take the Hit as Trading Volume Jumps
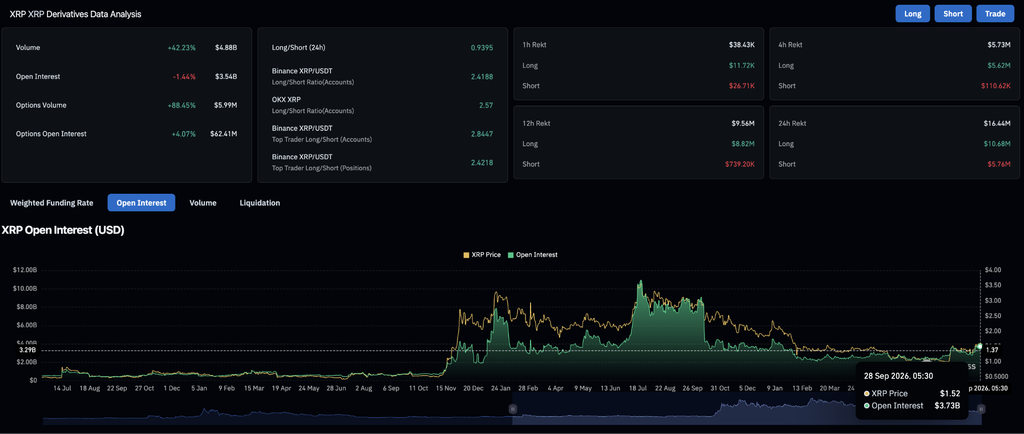
$XRP Derivative Analysis (Source: Coinglass)
$XRP derivatives volume jumped 42.23% to $4.88 billion over the past 24 hours, while open interest, the total value of open bets, slipped 1.44% to $3.54 billion. More trading alongside fewer open positions points to traders being forced out rather than adding new bets.
Longs took the bigger hit, with traders betting on higher prices losing $10.68 million against $5.76 million for those betting on lower prices, and nearly all of the last four hours’ $5.73 million came from longs. The crowd still leans bullish overall, with Binance showing 2.42 long accounts for every short account.
$XRP ETF Flows: An 11th Straight Week of Inflows Pushes Cumulative Total to $1.79 Billion
US spot $XRP ETFs added $22.65 million on September 25, capping a $75.59 million week that marked the 11th consecutive week of inflows and the largest weekly total since $110.49 million in late August. Cumulative net inflows stand at $1.79 billion, with total net assets at $1.77 billion.
Bitwise’s $XRP fund led Friday’s inflow at $18.39 million and remains the largest fund by net assets at $647.83 million, while Franklin’s XRPZ added $4.26 million and the other three funds were flat. 21Shares’ TOXR is still the only fund net negative since launch, down $21.15 million.
$XRP Exchange Flows: More Coins Leave Exchanges Than Arrive
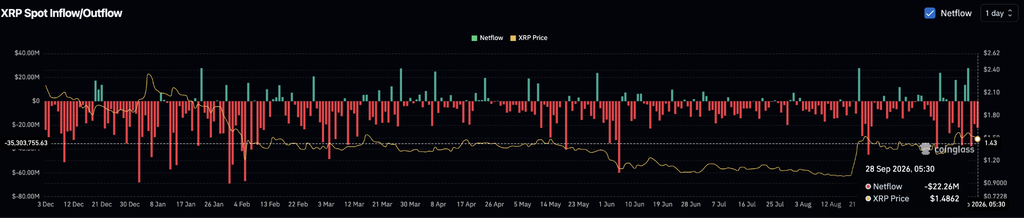
$XRP Exchange Netflow (Source: Coinglass)
$XRP’s spot netflow reads -$22.26 million so far today, meaning more coins left exchanges than arrived, which is typically read as holders moving $XRP off trading venues rather than lining it up to sell.
This tracks coins moving on and off exchanges, a separate measure from the ETF flows above.
$XRP Price Prediction: Bullish and Bearish Scenarios
$XRP holds the 20-day EMA at $1.4515 and reclaims the $1.55 neckline area analysts are watching. A confirmed break would put the triangle’s upper trendline near $1.64 in reach, and the $2 target cited by Ali Charts would need that trendline to clear first.
Bearish Case, Risk Level: $1.37 (200-Day EMA)
$XRP loses the 20-day EMA and the Parabolic SAR at $1.4157. More long liquidations would fit that scenario, exposing $1.3683, where the rising triangle trendline, the 200-day EMA, and the 50-day EMA at $1.3605 all meet, and a close below that would break the triangle’s lower boundary.
Related: Quant Price Prediction: QNT Surges Nearly 300% as Clearing House Selects Quant for Tokenized Deposit Network
FAQs
What is the $XRP price prediction right now?
$XRP could extend toward $1.55 and then the triangle’s upper trendline near $1.64 if it holds above the 20-day EMA at $1.4515. Losing that level risks a slide toward $1.3683, where the 200-day EMA and the triangle’s rising support meet.
Will $XRP reach $2?
It would need to clear roughly $1.55 first, the neckline of an inverse head and shoulders pattern flagged by analyst Ali Charts, who says a confirmed breakout could carry price toward $2. $XRP is trading below that neckline now, so it remains a scenario rather than a forecast.
Can $XRP reach $5.40?
Peter Brandt’s long-term chart implies an eventual advance to $5.40, but he described it as a projection rather than an active trade, and it reflects a decade of price structure rather than a near-term target.
Are $XRP ETFs still seeing inflows?
Yes. US spot $XRP ETFs logged an 11th consecutive week of inflows, adding $75.59 million last week and bringing cumulative net inflows to $1.79 billion. Two things to check: the triangle trendline values ($1.64 upper, $1.37 lower) are read off the chart by eye, and BeInCrypto’s $1.52 is older than the chart’s $1.4793, so I used the chart price.
The decline accelerated on Sept. 24, leaving Bitcoin largely confined to the $83,000 to $85,000 area before Monday’s move towards the lower end of that range.
Oil prices moved higher after tensions between the US and Iran deteriorated over the weekend.
Brent crude rose roughly 1.5% to 1.6% towards $106 per barrel after US President Donald Trump rejected Iran’s latest proposal concerning the reopening of the Strait of Hormuz.
Higher oil prices have kept inflation risks in focus because energy costs can feed into transport and production expenses.
The Strait of Hormuz remains particularly important to energy markets, with roughly 20% of global oil supply passing through the waterway.
At the same time, US Treasury yields remained elevated alongside oil, with the 10 year yield trading around 5.2% during the Asian session and the 30 year yield near 5.52%.
Higher yields have tightened financial conditions while raising the return available on government debt.
Federal Reserve officials have maintained a hawkish stance as inflation remains above target.
St. Louis Fed President Alberto Musalem said last week that more rate increases would likely be needed to contain inflation, with the Fed’s preferred inflation measure having risen to 3.7% in July.
Market pricing has moved in the same direction. Traders were assigning roughly a 66% probability to another Fed rate increase in October, while close to 90 basis points of further tightening had been priced through late 2027.
The US dollar has strengthened alongside those expectations. The dollar index was around 101.15 on Monday, close to a two month high and on course for a roughly 1.7% gain in September.
Bitcoin’s drop through $84,000 triggered some leveraged selling as well.
Derivatives data showed $BTC long positions being liquidated around $83,200 to $83,500, including an $844,000 Hyperliquid position near $83,479.
The individual liquidations remained small compared with the large liquidation events seen during sharper market moves.
Despite the latest price decline, US spot Bitcoin exchange traded funds continued to receive fresh capital last week, which has helped cushion some of the selling pressure as $BTC retreated from its $87,000 high.
The funds recorded roughly $2.39 billion in net inflows during the five trading sessions through Sept. 25, according to SoSoValue data.
Monday accounted for $999 million, followed by $714.7 million on Tuesday, $347 million on Wednesday, $190.6 million on Thursday and $134.5 million on Friday.
Friday extended the positive run to seven consecutive trading sessions, during which the funds attracted close to $3 billion.
However, daily inflows have fallen in each session since Monday’s $999 million intake, suggesting that ETF buying has slowed even as the funds continue to record net inflows.
$BTC price analysis
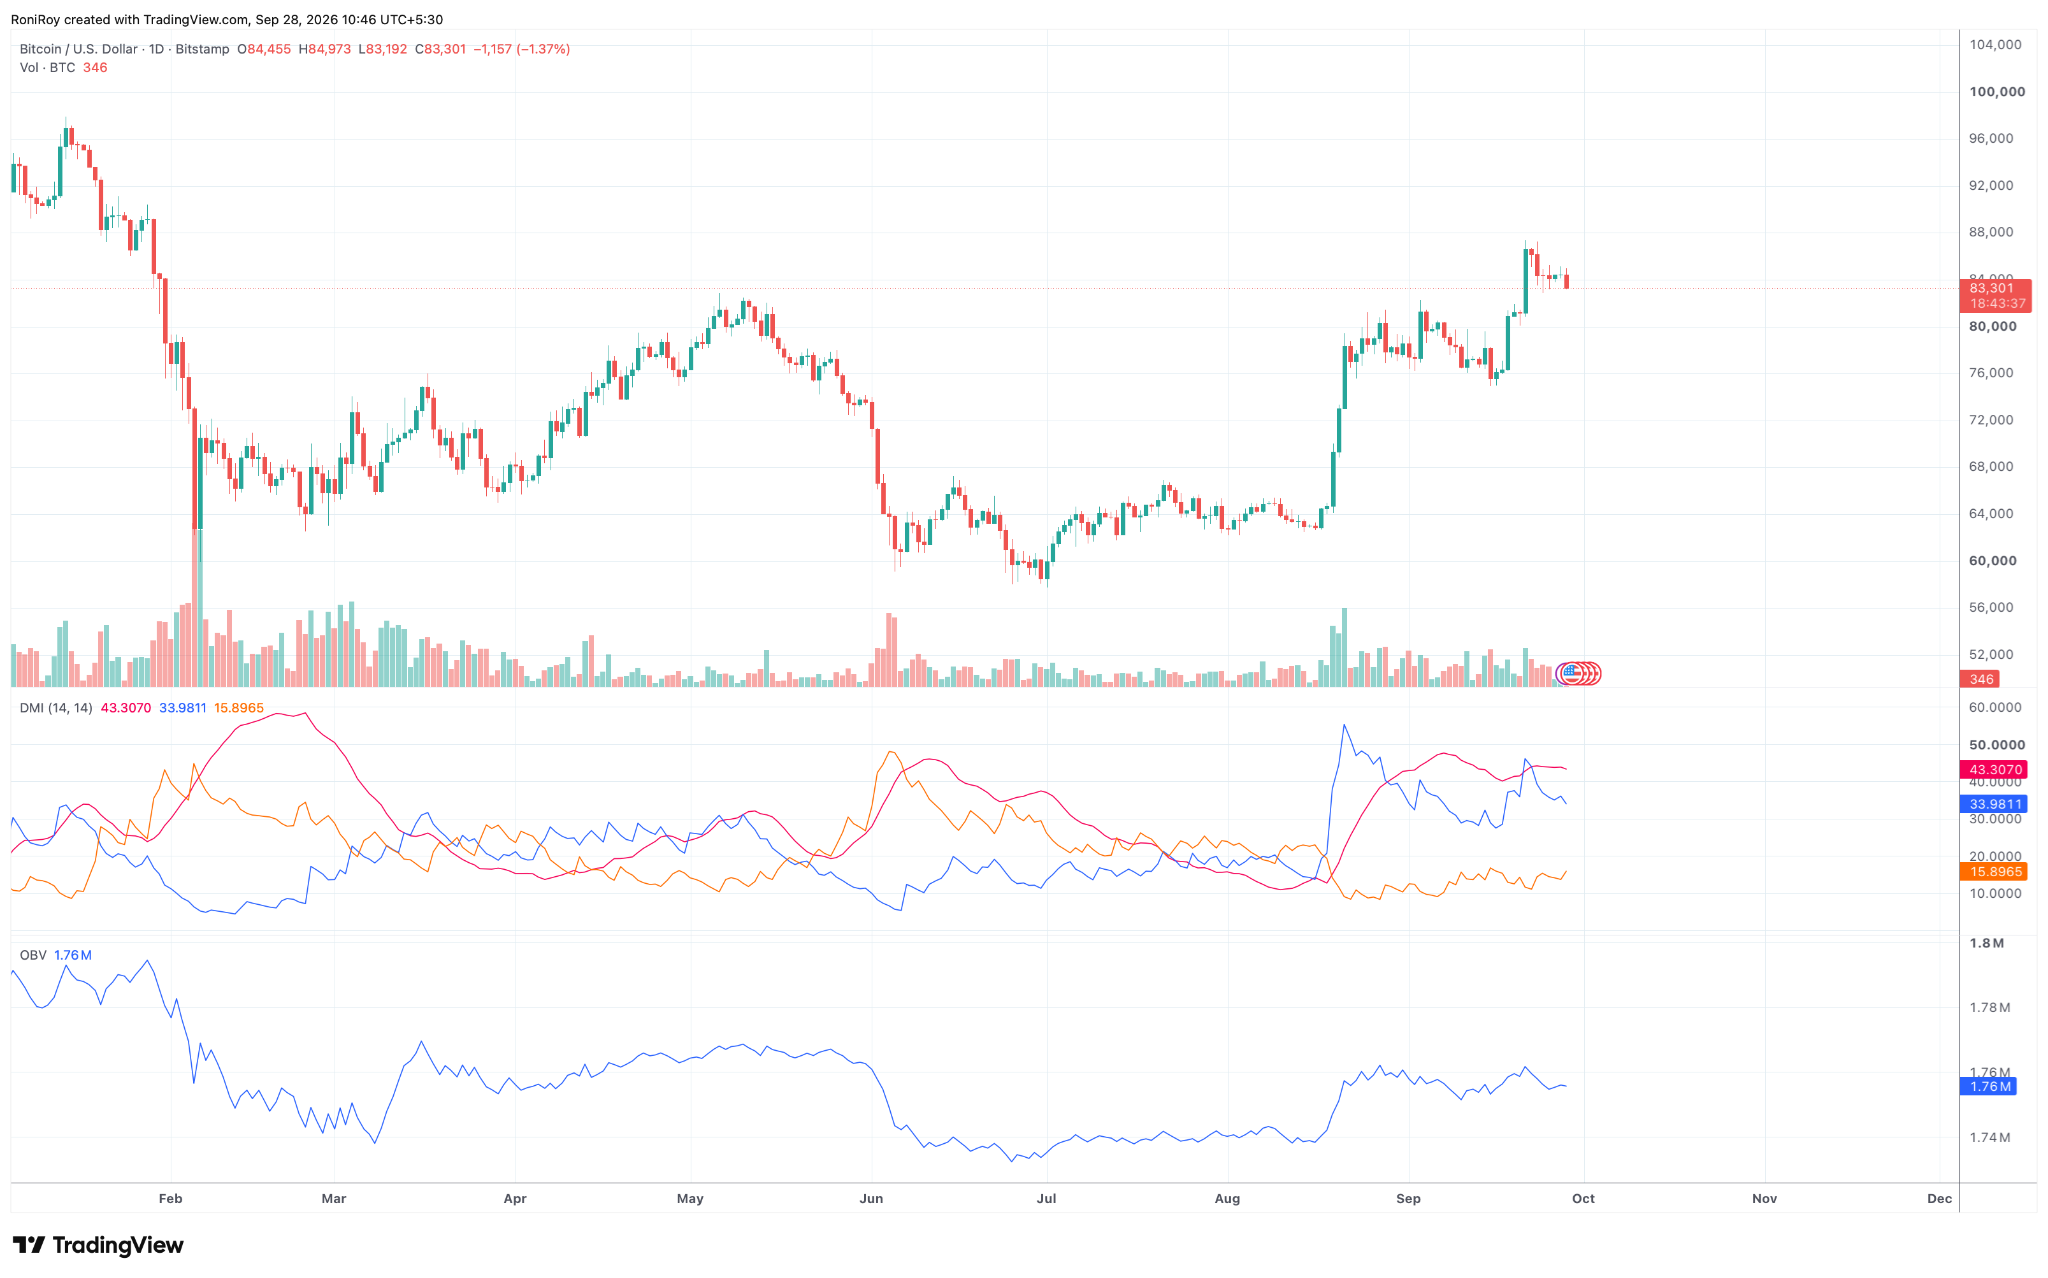
Bitcoin’s daily chart shows price holding above the breakout area established earlier in September, but buying momentum has weakened since $BTC reached $87,000. See below.
$BTC/USD 1-day price chart. Source: TradingView.
The Directional Movement Index still favours buyers on the daily timeframe.
The positive directional indicator stands at 33.98, well above the negative directional indicator at 15.90, while the Average Directional Index remains high at 43.31.
An ADX above 25 generally points to a well established directional move, but +DI has fallen from its recent peak as Bitcoin has retreated towards $83,000.
The gap between +DI and −DI means the larger daily trend has not yet flipped bearish.
A continued decline in +DI alongside a rise in −DI would weaken that structure, particularly if $BTC loses the support formed around $82,000 to $83,000.
On Balance Volume is near 1.76 million and has flattened after rising during Bitcoin’s September breakout.
OBV has slipped from its latest local high while $BTC has fallen from $87,000, showing that volume has not confirmed another push towards the recent high.
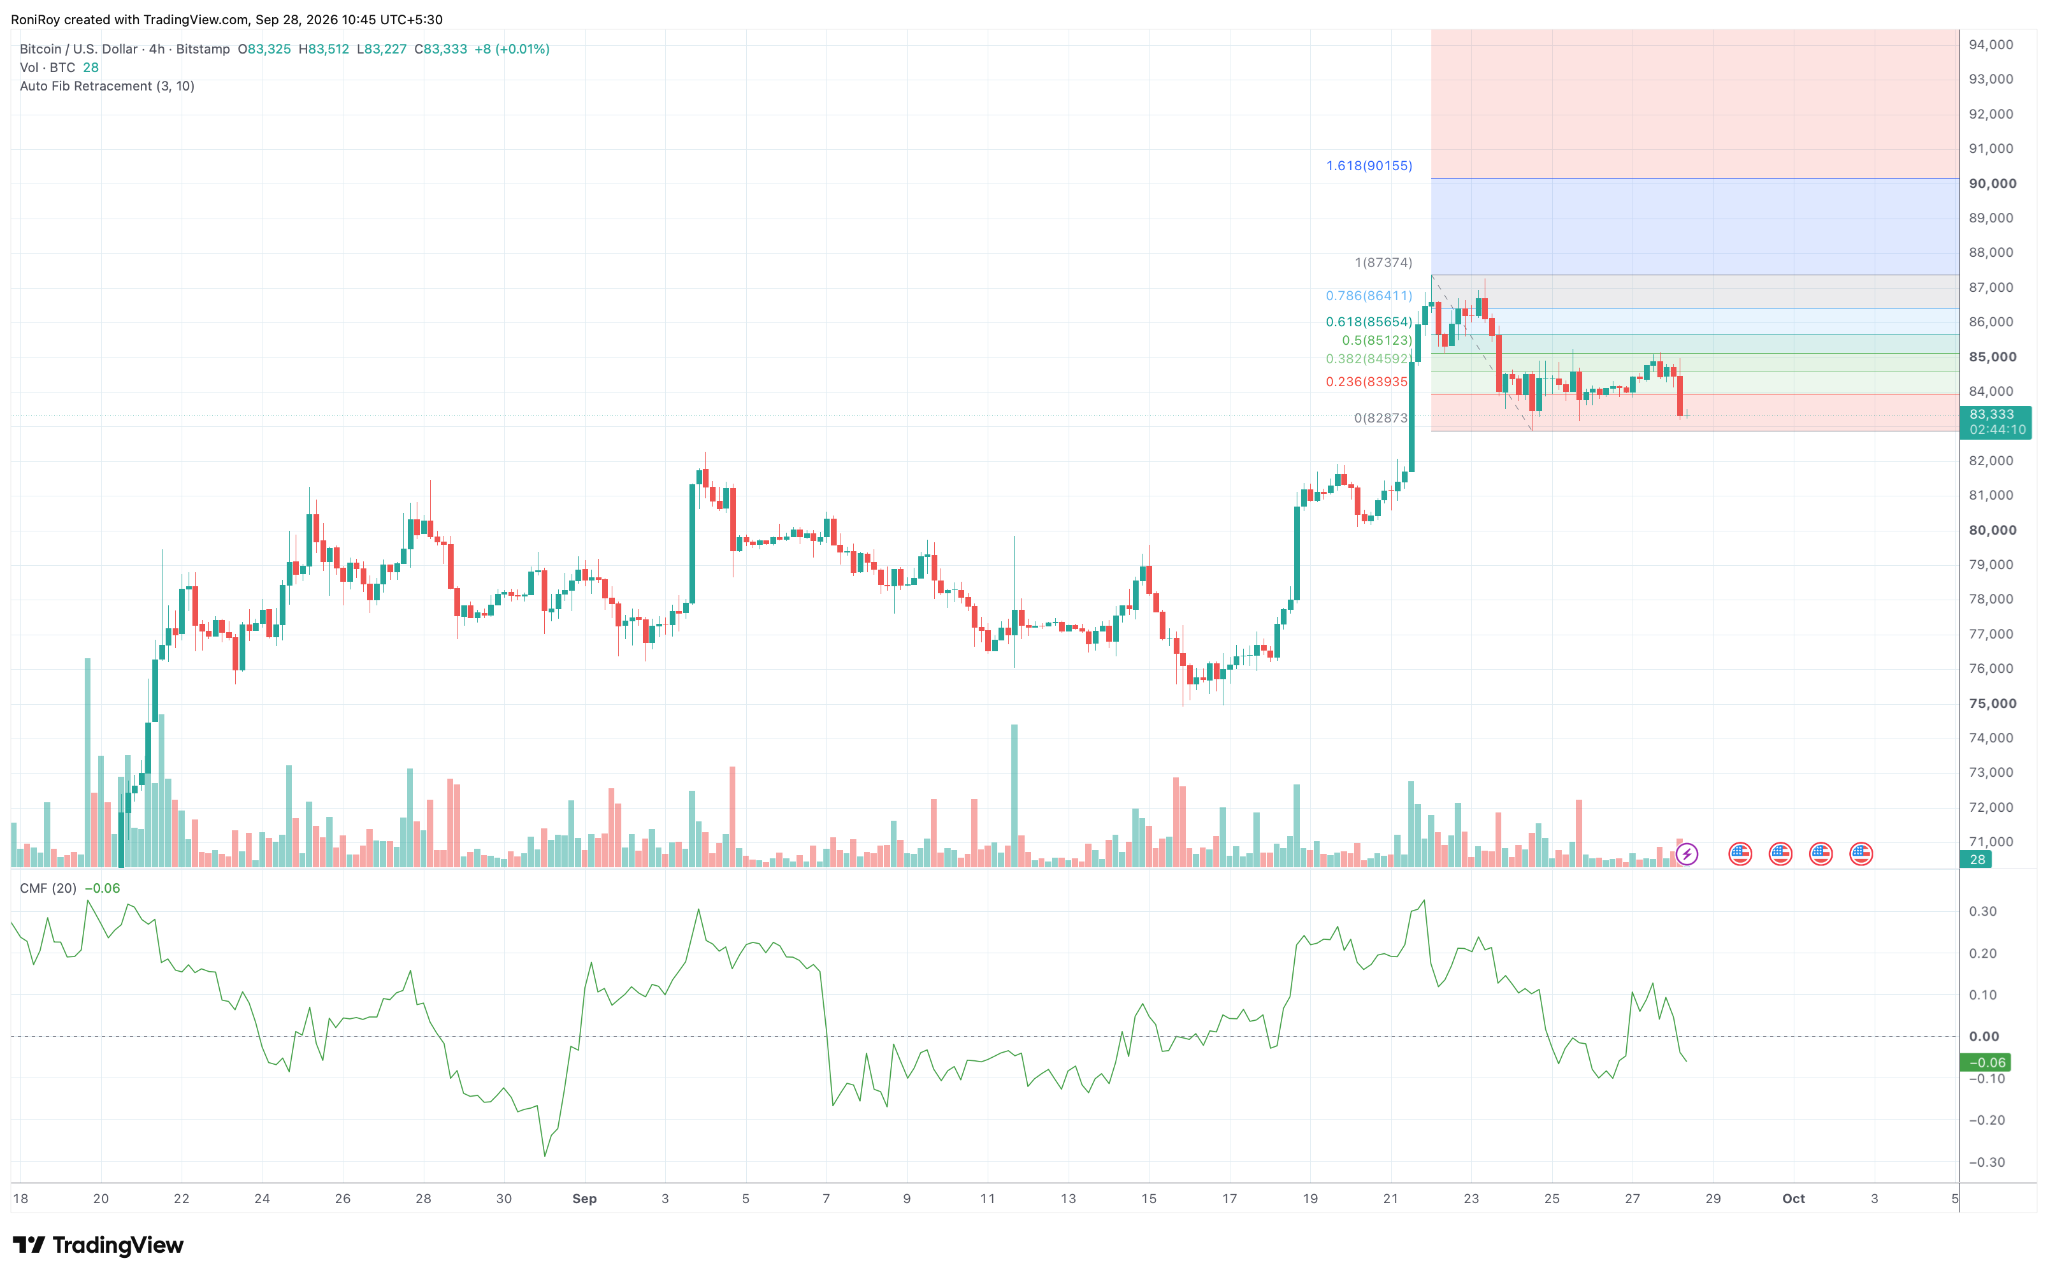
The 4-hour chart places the immediate support at $82,873, the low used for the latest Fibonacci range.
$BTC/USD 4-hour price chart. Source: TradingView.
Bitcoin is trading only slightly above that level after falling below the 23.6% retracement at $83,935.
Chaikin Money Flow has dropped to roughly −0.06 on the same timeframe.
CMF moved below zero during the latest selloff after briefly recovering into positive territory, indicating that selling volume has outweighed buying volume over its calculation period.
A 4-hour close below $82,873 would break the bottom of the current Fibonacci range.
The next visible price area sits around $81,000 to $82,000, followed by the previous breakout region around $80,000 if sellers continue to push $BTC lower.
Bitcoin would first need to reclaim $83,935 to move back inside the Fibonacci range.
Above it, the 38.2% level at $84,591 and 50% retracement at $85,123 form the next resistance levels.
A move through $85,123 would bring $85,654, the 61.8% retracement, back into focus.
The 78.6% level sits near $86,411, followed by the recent swing high around $87,374.