MARA Holdings, one of the largest publicly traded Bitcoin miners in the US, has made a significant change to its treasury policy for 2026.
According to the company’s 10-K report submitted to the U.S. Securities and Exchange Commission (SEC), MARA has gained the flexibility to sell its Bitcoin ($BTC) reserves held on its balance sheet when necessary.
This step represents a significant departure from the company’s past strategy of “holding the Bitcoins it produces as a long-term investment.”
MARA implemented a strategy change in the second half of 2025, allowing the sale of Bitcoin generated from operations, and approved the inclusion of balance sheet assets in the sale scope starting in 2026. The company stated that it may buy and sell Bitcoin from time to time depending on market conditions and capital allocation priorities.
As of December 31, 2025, MARA holds a total of 53,822 $BTC. Approximately 28% of these assets are managed within the framework of an active digital asset management strategy.
9,377 $BTC were lent to counterparties, while 5,938 $BTC were used as collateral for a $350 million loan. $32.1 million in interest income was earned from the lent Bitcoins.
However, the company also experienced a significant decline in value in 2025. Due to the drop in Bitcoin prices, the fair value of its assets decreased by $422.2 million. Furthermore, the 2,000 $BTC account managed at Two Prime recorded a net loss of $22.1 million.
MARA produced 8,799 $BTC in 2025, a 7% decrease compared to the previous year. This decline was attributed to the halving in April 2024 and the increased network difficulty.
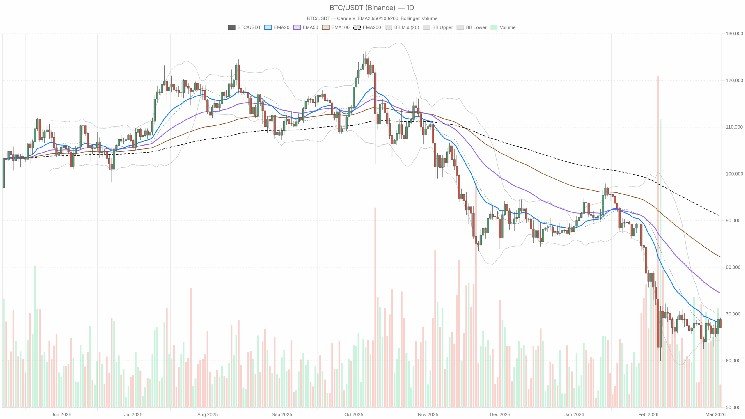
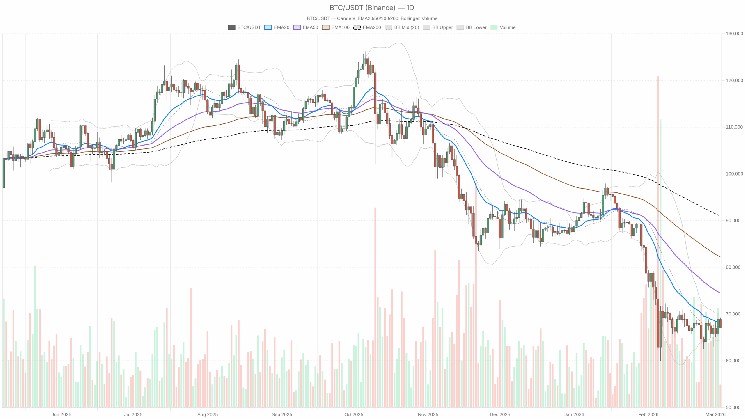
Markets are stuck between a corrective downtrend and stretched sentiment, where Bitcoin prezzo reflects both intense fear and signs of a tiring selloff.
$BTC/USDT — daily chart with candlesticks, EMA20/EMA50 and volume.
Bitcoin prezzo: fear is in control, but the selloff is getting tired
Bitcoin ($BTC) is trading around $67,100, sitting below its short- and medium-term daily moving averages after a difficult run of months. On the higher timeframe, the market is still in a corrective, bearish regime, but the combination of extreme fear (Fear & Greed at 14) and a volatility structure that is no longer accelerating suggests we are closer to the late part of the downtrend than the start.
Right now the dominant force is risk-off positioning: $BTC dominance is high at about 56.5% and total crypto market cap is modestly up on the day. This usually means capital is hiding in Bitcoin and stables while avoiding high-beta altcoins. The question for the next legs is simple: does this correction evolve into a deeper trend break toward the mid–$60Ks and below, or does fear overextend and fuel a sharp mean-reversion rally back toward the low–$70Ks?
On the daily chart the bias is bearish, but the intraday structure is not in free fall. Moreover, hourly and 15-minute timeframes show short-term oversold conditions and fading downside momentum, which opens the door for a corrective bounce inside a broader downtrend.
Daily timeframe (D1): macro bias remains bearish
Trend and EMAs (D1) – Price: $67,111 – EMA 20: $68,333 – EMA 50: $74,476 – EMA 200: $90,959 – Regime flag: bearish
$BTC is trading below all the major daily EMAs, with a clear downside stacking: price < 20-day < 50-day < 200-day. That is classic downtrend structure. The 20-day EMA is close enough to price to act as an immediate dynamic resistance; the 50-day and 200-day are much higher and currently irrelevant for short-term price, but they remind us how far $BTC has pulled back from prior highs.
What it implies: the main scenario is still bearish. Any bounce toward $68.3K–$70K is, by default, a rally into resistance unless $BTC can reclaim and hold above the 20-day EMA.
RSI 14 (D1): 43.8 Daily RSI is sitting just below the midpoint, in the low 40s. Momentum is negative but not washed out.
What it implies: sellers remain in control on the higher timeframe, but this is not extreme oversold territory. There is room for another leg down if macro or flows deteriorate, yet we are close to the zone where dip buyers usually start to step in more aggressively if the structure stabilizes.
The MACD lines are deeply negative, reflecting the strong prior downside phase, but the histogram is now positive: the MACD line has crossed above its signal line while still below zero.
What it implies: the downtrend on the daily chart is losing momentum. This is typically what you see in late-stage selloffs or early base-building phases: price may still drift lower or move sideways, but the persistent, clean downside impulse is fading. It does not give us a buy signal on its own; it says the worst momentum is likely behind us, unless a new shock hits.
$BTC is trading very close to the middle band, after spending time below it earlier in the move.
What it implies: volatility is elevated but not explosive, and price has migrated back toward the midline after weakness. That is typical in a consolidation phase inside a broader downtrend. The lower band around $64.4K is the immediate volatility support; repeated tags of that area without follow-through would reinforce a short-term bottoming narrative. A daily close back above the midline and heading toward the upper band would be the first sign of a more constructive mean reversion.
ATR 14 (D1): $2,964 Average daily range is close to $3K.
What it implies: volatility is high enough that 4–5% daily swings are entirely normal here. Position sizing matters: levels can be pierced intraday without necessarily breaking the broader structure. Traders should not overreact to a $1–2K move; it is just one average day of noise in this environment.
Daily pivot levels (D1) – Pivot point (PP): $67,815 – First resistance (R1): $68,554 – First support (S1): $66,372
Price is currently trading below the daily pivot but above S1.
What it implies: intraday, $BTC is leaning to the bearish side of the daily range, but it has not yet tested the first support. The $66.3K–$66.5K pocket is the first real line in the sand for today’s session; sustained trading below there would open the path toward the lower Bollinger Band near $64.4K.
Hourly timeframe (H1): weak, but not collapsing
On the 1H chart the system labels the regime as neutral, which matches what the indicators are showing: downside pressure, but no clean one-way trend.
Trend and EMAs (H1) – Price: $67,104 – EMA 20: $68,068 – EMA 50: $67,458 – EMA 200: $66,731
Price is under the 20- and 50-hour EMAs, but the 200-hour is still below price. The short-term averages have rolled over, but the longer intraday trend is not fully broken yet.
What it implies: this is a short-term pullback within a broader intraday range. Sellers have the upper hand on the hourly chart, but until price convincingly loses the 200-hour EMA around $66.7K, it is more of a corrective drift than a new, impulsive breakdown.
RSI 14 (H1): 41.4 Hourly RSI is in bearish territory, but far from oversold.
What it implies: intraday momentum is negative and supports the daily bearish bias, yet there is capacity for both further grinding down and sharp squeeze rallies. It is a “do not chase late” zone rather than a fresh high-conviction short area.
The MACD values are slightly positive but the histogram is negative, meaning the MACD line is crossing down under the signal line while both sit above zero.
What it implies: the prior intraday bounce has stalled, and momentum is shifting back to the downside, but the overall hourly trend has not flipped deeply bearish. Think of this as a market that tried to rebound, failed to sustain it, and is now drifting lower rather than cascading.
Price is trading in the lower half of the band range, closer to the lower band but not hugging it.
What it implies: bears are in control intraday, but volatility is contained. There is no sign yet of a volatility expansion move; instead, the market is bleeding lower within an established envelope.
ATR 14 (H1): $581 The average hourly range is around $580.
What it implies: $400–800 swings on an hourly basis are standard noise here. For execution, it means entries that are too tight to the pivot or recent swing can get shaken out quickly.
Price is trading slightly below the hourly pivot and above S1.
What it implies: the market is leaning bearish within today’s intraday structure, but has not yet broken the key $66.7K–$66.8K zone that aligns with both S1 and the 200-hour EMA. That confluence is the immediate short-term battleground.
15-minute timeframe (M15): execution layer, stretched on the downside
On the 15-minute chart, the regime is tagged as neutral, but here the details matter more for timing entries and exits than for bias.
Trend and EMAs (M15) – Price: $67,107 – EMA 20: $68,013 – EMA 50: $68,241 – EMA 200: $67,428
Price is below all the intraday EMAs, including the 200 on the 15-minute chart.
What it implies: short-term structure is clearly weak; any quick bounce into $67.4K–$68K is, initially, just a retest of broken supports and short-term moving averages. Fast money will be looking to fade those bounces unless higher timeframes start to confirm a reversal.
RSI 14 (M15): 22.3 This is deeply oversold on the very short timeframe.
What it implies: the 15-minute chart is ripe for a bounce or at least a pause. That does not change the daily bias, but it warns that pressing fresh shorts here on the smallest timeframe offers poor immediate reward-to-risk; a squeeze back toward the 20- or 50-EMA on M15 would be entirely normal.
Both MACD and signal are below zero, and the histogram is negative.
What it implies: short-term momentum is still to the downside, consistent with the oversold RSI. The market is weak, but because it is already stretched, this is where you often start to see jagged, two-way price action: sharp little rallies inside a broader intraday downtrend.
$BTC is trading below the lower band on this timeframe.
What it implies: price is extended to the downside on the micro view. That often leads to snap-back moves toward the midline, even if the larger trend is down. It is a poor spot to initiate new aggressive shorts, but not yet a clear reversal area on its own.
ATR 14 (M15): $266 Average 15-minute range is about $266.
What it implies: for scalpers, this is a wide tape; intrabar moves of $150–$300 are routine. Tight stops around obvious levels will be hunted; more thoughtful placement away from the noise is crucial.
Price is slightly below the 15-minute pivot and hovering near S1.
What it implies: the very short-term tape is leaning bearish but trying to stabilize near the first support. It is exactly the kind of area where you expect either a minor intraday bounce or an acceleration if S1 breaks on volume.
Sentiment and broader market context
The crypto-wide Fear & Greed Index sits at 14 (Extreme Fear). $BTC dominance around 56.5% alongside a modestly rising total market cap points to capital rotating into Bitcoin and stables while the market de-risks elsewhere.
What it implies: fear is real, but it is already heavily priced in. Historically, extreme fear readings during a corrective phase often precede strong relief rallies, though they do not pinpoint timing. As long as dominance stays elevated and altcoins underperform, Bitcoin remains the relative safe asset within crypto, even if its own price is under pressure.
Scenarios for Bitcoin prezzo: where do we go from here?
Main bias from D1: bearish, but late-stage and vulnerable to a squeeze.
There is a clear tension across timeframes:
Daily chart: downtrend structure, negative but easing momentum.
Hourly chart: neutral-to-bearish drift, no capitulation.
15-minute chart: oversold and stretched, due for a bounce.
That mix usually resolves either into a relief rally inside a downtrend or a final flush that resets the shorter timeframes before a more meaningful reversal.
Bullish scenario (countertrend, then potentially more)
In the bullish path, the current oversold intraday setup turns into a rebound that gains traction on higher timeframes.
Key steps for this scenario:
1. Short-term stabilization above $66.5K The $66.3K–$66.8K zone is critical: it combines daily S1, hourly S1, and the H1 200 EMA. Holding above this area and putting in higher lows on the 15-minute and hourly charts would signal sellers are losing control intraday.
2. Reclaim of intraday moving averages Price needs to retake the 15-minute 200 EMA near $67.4K and then the 20- and 50-hour EMAs around $67.5K–$68.1K. That would turn the current bleed into a short-term trend reversal.
3. Break back above the daily pivot and 20-day EMA A daily close above the pivot at $67.8K and, more importantly, above the 20-day EMA near $68.3K would be the first serious sign that the correction is maturing. From there, a move toward the upper daily Bollinger Band and the $70K–$71K region becomes realistic.
4. Extension toward $72K–$74K If momentum improves and volume expands on the way up, the next logical magnet would be the prior supply area in the low–$70Ks, with the 50-day EMA at $74.5K as a stretch target for a full mean-reversion swing.
What invalidates the bullish scenario? A clean break and daily close below $64.4K (the lower daily Bollinger Band) would strongly argue that the market is not ready to base yet. That would put the focus back on lower supports and delay any sustained upside for weeks, not days.
Bearish scenario (trend continuation, potentially one more leg down)
In the bearish path, the daily downtrend re-asserts itself, and the short-term oversold conditions on the 15-minute chart are worked off via a shallow bounce that fails quickly.
Key steps for this scenario:
1. Failure to reclaim $68K If every small rally gets sold before $BTC can regain the hourly EMAs and the daily pivot, it signals strong supply overhead. Repeated rejections around $67.5K–$68.0K would confirm this.
2. Break of $66.5K and $66.3K supports Losing the $66.7K 200-hour EMA and the clustered S1 levels would open the door to a test of the daily lower band around $64.4K. In that move, 15-minute oversold conditions could persist as price grinds lower.
3. Daily close near or below the lower Bollinger Band ($64.4K) A decisive daily candle closing at or beneath the lower band would mark a volatility expansion to the downside, likely driven by renewed fear, liquidations, or macro headlines. From there, traders would start discussing deeper retracement zones below $60K.
4. Momentum rollover on D1 indicators If the MACD histogram on D1 turns back down toward zero or negative while RSI sinks into the 30s, it would confirm that the early signs of momentum easing were a false dawn and that the trend is accelerating again.
What invalidates the bearish scenario? A sustained move and daily close above $70K, accompanied by rising volume and a firm MACD histogram on the daily chart, would severely weaken the bearish narrative. In that case, the recent leg would be better framed as a correction in a larger bull market, with the path of least resistance shifting back upward.
Positioning, risk, and how to think about Bitcoin prezzo here
This is a tricky part of the cycle. The daily chart says downtrend, the intraday chart says tired but not reversed, and sentiment says everyone is scared. Those conditions often deliver sharp, counterintuitive moves in both directions.
A few practical takeaways for traders analyzing Bitcoin prezzo in this environment:
Respect the daily downtrend. Unless and until $BTC can reclaim the 20-day EMA and hold it, rallies are guilty until proven innocent. That argues against blindly buying every dip.
Do not ignore extreme fear. With sentiment this depressed and the daily MACD starting to turn, the risk of a violent short-covering rally is real. Shorts added late into intraday oversold conditions can be painful.
Size for volatility. With a ~$3K daily ATR and $500+ hourly ranges, levels will be overshot routinely. If your positioning cannot tolerate a few thousand dollars of noise against you, your sizing is probably too large for this tape.
Use confluence, not single signals. The more alignment you see between key supports (pivot levels, EMAs, Bollinger Bands) across timeframes, the more meaningful the area. Right now, $66.3K–$66.8K is one such zone on the downside; $68K–$70K is shaping up as the equivalent on the upside.
Overall, $BTC is in a corrective downtrend dominated by fear, but the internal momentum picture is no longer one-sided. For traders, this is a phase to stay nimble, respect both tails, and let the levels, not emotions, dictate whether the next big move is a breakdown or a squeeze higher.
Bitcoin traded near $68,000 on Tuesday as U.S. spot ETFs pulled in $458 million, according to data curated by SoSoValue, marking one of the quarter’s strongest inflow days despite the ongoing conflict with Iran.
The inflows suggest institutional investors are treating bitcoin’s recent volatility stemming from the war as contained rather than systemic.
Singapore-based trading firm QCP Capital said in a recent note that the roughly $300 million in long liquidations triggered by the weekend headlines were “notable but contained,” arguing that positioning had already been materially lightened in recent weeks.
Options markets told a similar story, QCP wrote, with one-day implied volatility briefly spiking to 93% before quickly retracing, a sign traders were hedging event risk rather than bracing for prolonged escalation.
Meanwhile, U.S. spot bitcoin ETFs added $1.1 billion over three consecutive sessions last week, according to SoSoValue data previously reported by CoinDesk, with BlackRock’s IBIT accounting for roughly half.
Palantir’s billionaire co-founder Peter Thiel on Monday filed with the SEC to offload 2 million shares in the data analytics firm for $280 million.
Thiel helped establish the company in 2003 alongside Alex Karp, Joe Lonsdale, Stephen Cohen, and Nathan Gettings. He contributed $30 million in seed capital, drawing inspiration from fraud-detection systems he developed at PayPal.
Early backing from In-Q-Tel, the CIA’s investment arm, enabled the firm to launch its Gotham platform in 2008, which serves intelligence and defense clients. The company went public in 2020.
Palantir capped 2025 with a strong fourth quarter, reporting revenue of $1.4 billion, up 70% year over year and above expectations. Adjusted earnings per share came in at $0.25, topping projections of $0.23.
The outperformance was fueled by a 137% surge in US commercial revenue and a 66% increase in US government sales. Palantir also guided to $1.5 billion in first-quarter revenue and roughly $7.2 billion for 2026, both above Wall Street expectations.
Pump.fun, a Solana-based token launchpad, announced a significant expansion of its mobile application today, allowing users to trade assets beyond its native ecosystem for the first time.
It’s time to bring the Pump fun app to the next level
For the first time ever, users can trade more than just Pump fun coins
With support for other launchpads, WBTC, $PUMP, USDC & more, the Pump fun app is more versatile than ever 👇 pic.twitter.com/FkKEwJ8zR8
— Pump.fun (@Pumpfun) March 2, 2026
The platform said its app now supports tokens from external launchpads alongside established Solana assets including $PUMP, wrapped Bitcoin and wrapped Ethereum through Wormhole, GIGA, and PENGU.
The shift transforms the interface from a single-launchpad tool into a multi-asset trading environment.
The company reported its mobile application has exceeded 1.5 million downloads over the past year. It characterized the update as an effort to minimize user friction by enabling trading and custody of diverse assets within a single platform.
Promotional material accompanying the announcement displayed mentions of Raydium and Meteora within the interface, suggesting additional protocol integrations may follow.
Crypto analytics firm Elliptic detected a significant spike in digital asset withdrawals from Nobitex, Iran’s dominant crypto exchange serving more than 11 million users, in the immediate aftermath of initial US-Israel military strikes on Iranian territory.
The London-based blockchain intelligence company said the surge in outflows last Saturday may indicate capital flight. Outgoing transaction volumes spiked by 700% within minutes of the first strikes.
Elliptic said the data suggests Iranian users converted rials into digital assets and moved funds to external wallets beyond the reach of conventional banking oversight.
Nobitex handled $7.2B in crypto transactions in 2025, establishing itself as a cornerstone of Iran’s digital asset infrastructure. The platform has faced scrutiny over alleged financial ties to the Islamic Revolutionary Guard Corps.
In January, Elliptic reported evidence suggesting Iran’s central bank utilized the exchange to prop up the country’s weakening currency.
Early tracing of recent withdrawals shows funds flowing toward foreign trading platforms that have historically absorbed substantial volumes originating from Iran.
The pattern mirrors previous episodes this year. The most pronounced earlier spike occurred on January 9, coinciding with mass protests and a government-imposed internet shutdown. Withdrawal activity declined during the blackout but persisted at reduced levels, suggesting some users maintained access to their holdings despite the platform going offline.
Two subsequent surges aligned with fresh US sanctions announcements targeting Tehran, reinforcing observations that digital assets serve as a potential route around financial restrictions.
TD Securities, a major Canadian investment bank with operations across North America, says tokenization may be approaching an institutional turning point following the New York Stock Exchange’s push into tokenized equities.
In recent commentary, TD Securities Reid Noch, vice president for electronic trading, said tokenization is beginning to carry real implications for market structure, pointing to the NYSE’s proposed tokenized equities alternative trading system (ATS) as a key development.
The planned platform would enable 24-hour trading and near-instant settlement of tokenized stocks and exchange-traded funds (ETFs), subject to regulatory approval.
Rather than creating a parallel crypto-native marketplace, the venue is designed to operate within existing US market rules while leveraging blockchain-based settlement infrastructure.
Source: Cointelegraph
Noch described the structure as closer to a “2.0” market shift, where custody and settlement would remain anchored to the Depository Trust & Clearing Corporation (DTCC), while trading would comply with National Best Bid and Offer (NBBO) requirements. This means prices must reflect the best available bid and offer across U.S. exchanges to prevent fragmented liquidity.
Although Noch said early activity is expected to be retail-driven, the broader implications extend well beyond individual traders.
TD Securities’ institutional focus suggests the company sees potential impact on core market plumbing, including trading hours, collateral management, settlement cycles and liquidity, areas that shape how large financial institutions operate.
Tokenized equities gain institutional traction
Tokenization accelerated in 2024, led primarily by private credit and U.S. Treasury products, which have accounted for the bulk of onchain real-world asset (RWA) issuance, according to industry data.
Despite broader crypto market volatility, capital inflows into tokenized assets have continued, suggesting sustained institutional interest in blockchain-based settlement and ownership models.
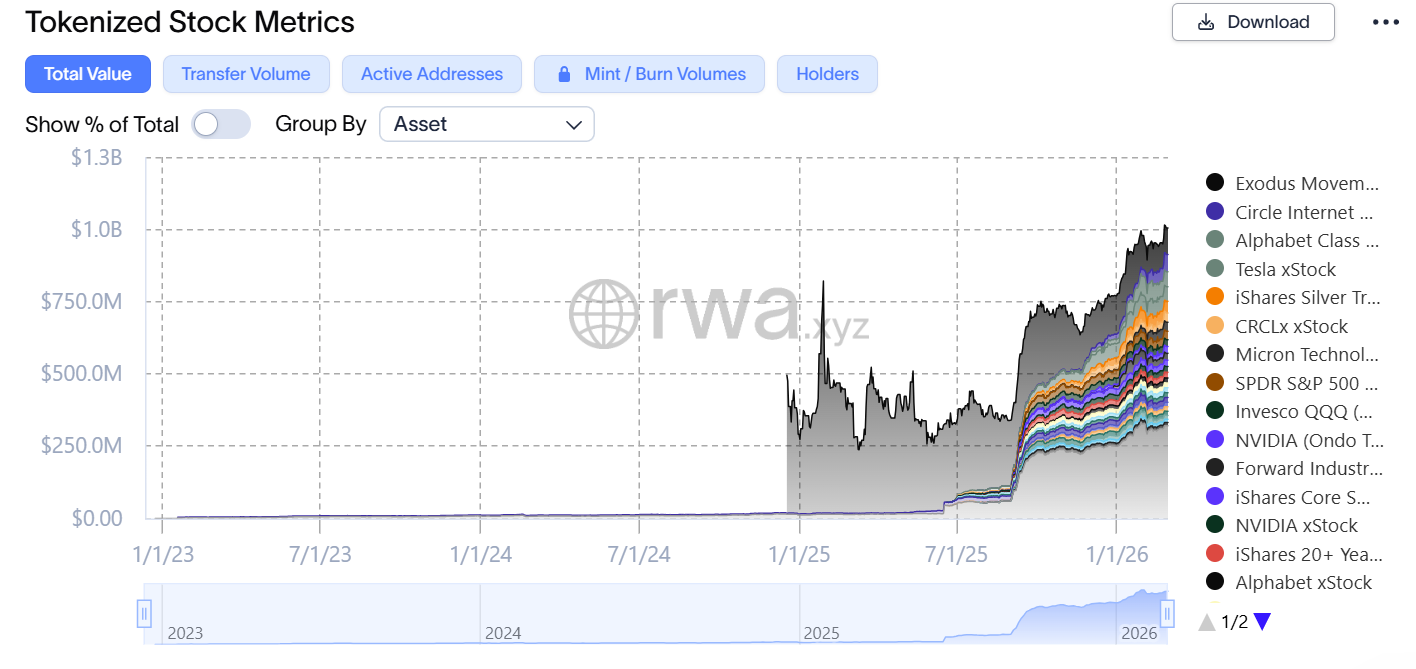
More recently, tokenized equities have begun gaining traction. Kraken’s xStocks platform has emerged as one of the more visible entrants, reporting more than $25 billion in cumulative trading volume since launching last year.
The market for tokenized stocks has grown rapidly. Source: RWA.xyz
Although tokenized equities remain a small fraction of global stock market activity, their growth reflects a broader shift toward bringing traditional financial instruments onchain within regulated frameworks.
Bitcoin’s latest governance clash escalated this week as the first block signaling support for a temporary soft fork designed to restrict arbitrary, non-monetary data in the blockchain’s transactions was produced by mining pool Ocean.
The proposal, formally assigned BIP-110 after evolving from earlier drafts, aims to reinstate strict limits on transaction output sizes and arbitrary data fields for about a year. The idea is to curb what proponents see as “spam” uses of block space for non-financial data. They argue that unchecked data, including large inscriptions and so-called OP_RETURN payloads, threaten the original blockchain’s role as sound monetary infrastructure and burden node operators.
The community remains deeply divided. Prominent critics, including Blockstream CEO Adam Back, have warned that consensus-level intervention could harm Bitcoin’s credibility and lead to preferential treatment of some transactions in violation of the principle of neutral transaction capacity. He also questioned the level of support for the proposal, which, he said, increased the risk of the blockchain being split.
Adding fuel to the debate, a developer recently inscribed a 66 KB image in a single transaction on Bitcoin, an apparent pushback against BIP-110’s core claims and a demonstration of how large amounts of data can be encoded even without relying on OP_RETURN.
OP_RETURN and similar approaches are script instructions used to mark a transaction output as invalid for spending, effectively allowing users to repurpose that space to permanently embed arbitrary data — like text or images — directly into the blockchain
As the controversy unfolds, it underscores enduring philosophical tensions within Bitcoin. Should network aggressively defend a narrowly defined monetary purpose or maintain maximal neutrality toward arbitrary uses of its base layer?
The crypto bear market has dragged down most major digital assets this year, but $HYPE has moved in the opposite direction. Year to date, the token is up 23.9%, matching gold’s gain over the same period. The S&P 500 is slightly negative, while bitcoin has fallen 23.7% and ether more than 33%.
The divergence is notable not only because $HYPE is crypto-native, but because it has decoupled from the broader digital asset market. Its performance increasingly reflects the value of the platform behind it rather than the market’s direction.
HyperLiquid, the decentralized derivatives exchange that underpins $HYPE, is built to monetize activity rather than price appreciation. In bull markets, capital tends to concentrate in spot exposure. In choppier conditions marked by drawdowns and macro shocks, derivatives volume tends to persist. Traders shift from buying to positioning, and the platform collects fees on both sides.
While trading volume on competitor platforms Aster and Lighter has tumbled in recent months, HyperLiquid’s has increased, rising from $169 billion in December to more than $200 billion for both January and February. Aster, meanwhile, went from $177 billion in December to less than $100 billion in February, with Lighter suffering an even sharper drop, DefiLlama data shows.
Total volume on HyperLiquid since its inception has now hit a whopping $4 trillion.
Volatility as a business model
HyperLiquid’s core product is perpetual futures, which allow traders to go long or short with leverage. When prices grind higher, leverage amplifies upside. When markets slide, shorting and basis trades step in. The exchange collects fees on both sides.
That structure becomes particularly relevant in a year marked by turbulence across asset classes. Rather than relying on sustained price appreciation, the exchange captures turnover. In sideways or declining markets, traders often increase frequency, hedge exposure, or rotate into relative-value strategies. Activity replaces direction as the primary driver.
And that business model has yielded positive results. Gross protocol revenue grew by 96% in Q3 of 2025 to $354 million, with the fourth-quarter total hitting $286 million, the majority of which came from perpetual trading fees.
That revenue comes from a super-lean team of fewer than 15 employees, with half focused on engineering. HyperLiquid founder Jeff Yan has also refused investment from venture capitalists to maintain independence – a bold approach uncommon in the crypto industry.
Trading beyond market hours
More recently, HyperLiquid has expanded beyond crypto-native pairs. It now offers synthetic exposure to foreign exchange, commodities and major equity indices. It also provides weekend trading for U.S. equities, an innovation that resonates with retail traders accustomed to crypto’s round-the-clock rhythm.
For a generation raised on app-based brokerage platforms, the traditional market calendar feels restrictive. As seen over the past weekend, geopolitical escalations often land outside the typical weekday trading window. HyperLiquid’s structure allows traders to react in real time rather than wait for Monday’s open.
HyperLiquid’s silver market has also been a resounding success with trading volume nearing $750 million over a recent 24-hour trading period despite traditional markets being closed for the majority of Sunday.
The exchange has also introduced pre-IPO perpetual markets tied to companies such as Anthropic, OpenAI and SpaceX. These instruments are synthetic and do not confer equity ownership, but they offer directional exposure to private companies. In effect, they create a parallel venue for price discovery among retail participants otherwise excluded from late-stage venture valuations.
The product FTX tried to build
The model carries echoes of an earlier vision. FTX pitched 24-hour trading, tokenized equities and seamless leverage across asset classes. Its collapse stemmed from custody risk, shoddy balance-sheet practices, and the commingling of funds.
HyperLiquid operates on a non-custodial framework, with on-chain settlement and transparent vault mechanics. Users interact with smart contracts rather than deposit funds into a centralized entity’s balance sheet. In a post-FTX landscape, that distinction carries weight. Retail traders who absorbed losses from centralized failures remain sensitive to counterparty exposure.
HyperLiquid delivers many of the features once marketed by FTX, but through infrastructure designed to reduce reliance on a single custodian.
The exchange also leans into competition and gamification. Leaderboards prominently rank traders by performance, creating protagonists like James Wynn, who lost $100 million on HyperLiquid after engaging in a high-risk long-only trading strategy using leverage when bitcoin was above $100,000.
The mechanic encourages engagement. Traders can build reputations through short positions, market-neutral strategies or well-timed directional bets, and that creates a buzz on social media – effectively acting as a marketing vehicle even in volatile markets.
The centralization test
Claims that HyperLiquid is insulated from bear markets require context. One year ago, the protocol faced a credibility shock that raised questions about decentralization.
In April 2025, the total value locked in the Hyperliquidity Provider vault fell from $540 million to $150 million within a month. The trigger was a trading episode involving a token called JELLY. A trader opened a large short position on HyperLiquid while simultaneously buying the token on illiquid decentralized exchanges. Thin liquidity distorted price feeds and forced the vault into a toxic position via liquidation.
As JELLY’s reported price spiked to levels unsupported by deep liquidity, the vault’s unrealized losses mounted. HyperLiquid intervened, force-closing the market and settling JELLY at $0.0095 rather than the roughly $0.50 price being relayed by oracles. The decision protected the vault from substantial losses, but it ignited backlash.
Critics argued that a protocol marketed as decentralized had exercised discretionary control reminiscent of a centralized exchange. Governance optics deteriorated quickly. Yield on the vault fell sharply, and users withdrew capital.
Security researchers described the episode as an economic design flaw rather than a smart contract exploit. Jan Philipp Fritsche of Oak Security characterized it as unpriced vega risk, where leveraged exposure to volatile assets drained the risk fund in a predictable manner. The episode underscored that economic vulnerabilities can be as destabilizing as technical bugs.
HyperLiquid later modified its governance process, shifting asset delistings to an on-chain validator voting mechanism. The change did not eliminate scrutiny, but it addressed one of the central criticisms.
The vault has since recovered to $380 million in TVL, offering users a 6.93% APR.
Resilience through activity
Despite the controversy, trading volume on the exchange remained robust, and with competitors Aster and Lighter losing momentum, HyperLiquid is positioning itself as a mainstay in the ongoing cryptocurrency bear market.
Risks remain. Regulatory attention could intensify around synthetic exposure to private companies and U.S. equities. Liquidity fragmentation in thinner markets could resurface pricing distortions. Governance mechanisms will continue to be tested under stress.
Yet $HYPE’s relative strength this year reflects a structural distinction. Rather than functioning as a high-beta bet on digital asset appreciation, it increasingly behaves like a claim on a venue that monetizes volatility.
In a cycle defined less by sustained rallies and more by sharp swings, that positioning has mattered.
Bitcoin (BTC) and altcoins started the new week with the US-Iran conflict. Bitcoin fell to $63,000 over the weekend before recovering to around $66,000.
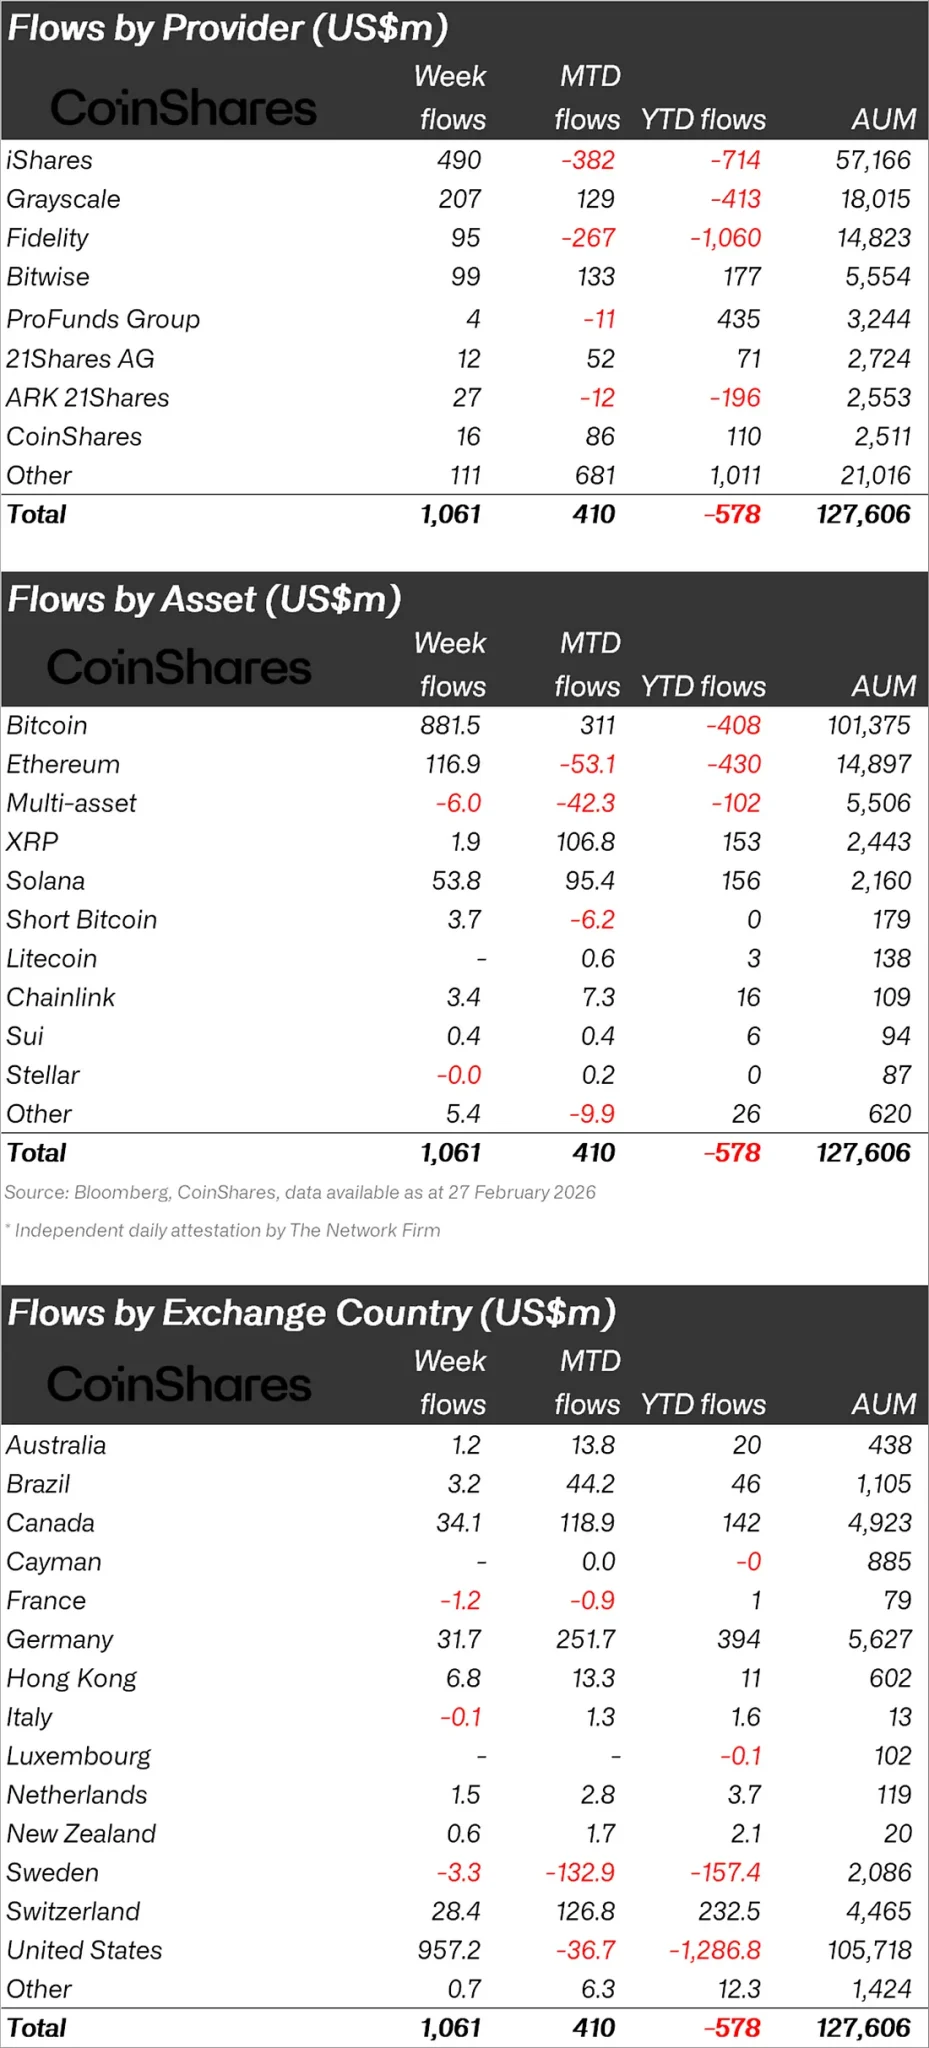
As market weakness and uncertainty persist, Coinshares released its cryptocurrency report, stating that it experienced $1 billion in inflows last week.
“Cryptocurrency investment products saw $1 billion in inflows, ending a five-week streak of $4 billion in outflows.”
“The decline in prices, technical resets, and the regrouping of large investors supported this trend.”
Bitcoin and Altcoins Relieved!
Looking at crypto funds individually, it was observed that inflows were mainly in Bitcoin.
Bitcoin saw inflows worth $881.5 million, while Ethereum (ETH) experienced inflows of $116.9 million.
Looking at other altcoins, XRP saw inflows of $1.9 million, Solana (SOL) $53.8 million, and Chainlink (LINK) $3.5 million.
“Bitcoin was the top performing asset with inflows of $881 million.”
Ethereum also saw inflows totaling $117 million. This was the largest inflow since mid-January.
Both Ethereum and Bitcoin have remained in a net outflow position since the beginning of the year.
In contrast, Solana saw inflows of $53.8 million last week and $156 million since the beginning of the year.
Chainlink saw a small inflow of $3.4 million, with no other significant outflows.
Looking at regional fund inflows and outflows, the US ranked first with an inflow of $957 million.
After the US, Canada saw inflows of $34.1 million, Germany $31.7 million, and Switzerland $28.4 million. In contrast, Sweden experienced small outflows of $3.3 million and France $1.2 million.