Tag: CRYPTOS FoxBusiness.

  • IBM Opens Quantum Hardware to Researchers as Bitcoin Security Threat Looms

    IBM Opens Quantum Hardware to Researchers as Bitcoin Security Threat Looms

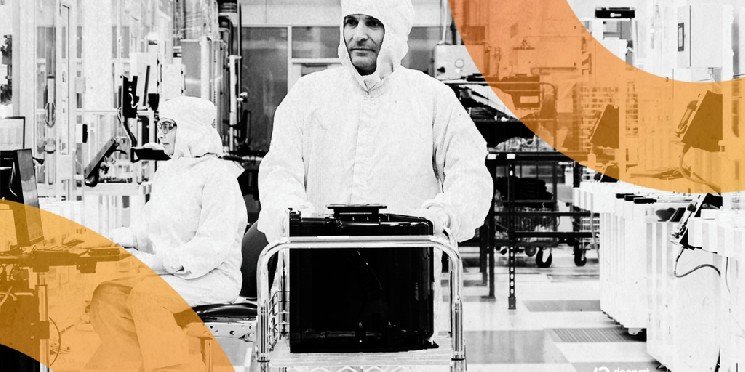
    IBM is expanding free access to its quantum computers, giving researchers more time with powerful hardware to run experiments as the threat of future quantum advancements hangs over the crypto industry.

    The company said Monday it is updating the IBM Quantum Open Plan, a free cloud platform that lets anyone run experiments on real quantum machines. The changes increase runtime limits, add new training resources, and allow access to one of IBM’s more advanced processors.

    “Starting today, researchers on the Open Plan who use 20 minutes of runtime within any 12-month period can opt in to a special one-time promotion and get 180 minutes of runtime for the next 12 months,” IBM said in a statement.

    IBM’s Open Plan usually gives users 10 minutes of time on a quantum computer every 28 days, which lets researchers run small experiments, test algorithms, and try simple quantum programs.

    The update comes as Bitcoin developers debate how soon quantum computing could eventually challenge the cryptography that secures the network.

    IBM is also opening access to its Heron R2 processor, called ibm_kingston—a more advanced quantum system capable of running large numbers of quantum operations quickly while keeping error rates relatively low.

    With the expanded runtime and hardware access, IBM said, researchers can run more advanced workloads, including hybrid optimization algorithms, error-mitigation experiments, and other research tied to quantum computing. IBM is also introducing a course focused on planning research programs, identifying use cases, and securing research funding.

    Over the past year, IBM has reported a series of advances aimed at scaling up its quantum systems.

    In October, IBM researchers entangled 120 qubits into a single GHZ “cat state,” demonstrating large-scale quantum entanglement. A month later, the company introduced its 120-qubit Nighthawk processor along with a roadmap targeting verified quantum advantage, when a quantum computer can outperform traditional computers, before the end of 2026.

    These advances are part of IBM’s broader roadmap, aimed at building quantum computers stable enough to correct their own errors and run complex algorithms without the noise that currently limits quantum systems. The goal is to accomplish those tasks by the end of the decade.

    “Open-access quantum computing shouldn’t just be for beginners running small circuits,” IBM said. “We want to ensure that even serious researchers can extract real value from the IBM Quantum Open Plan for serious experiments and proof of concept work. With 180 minutes of compute on our quantum hardware, you’ll be able to do that.”

    As tech giants like IBM invest more and more heavily in quantum computing, blockchain researchers are sounding the alarm about the risk involved. Bitcoin developers recently advanced a proposed framework called BIP 360 for dealing with the quantum threat, though it still must undergo a formal review.

    “The argument about whether quantum is real or whether we should take it seriously is something I tend not to engage with much, because I think long-term reality will make that argument,” cryptographer and BIP 360 co-author Ethan Heilman told Decrypt.

    “What we’re trying to do is marshal the people who do believe it’s important to get everything set up—to think through all the issues and get the software ready—because by the time it becomes real, we’ll have won the argument and we’ll also be ready to implement,” he said.

    Even so, the timeline for a real threat remains uncertain. A recent report from Ark Invest and Bitcoin financial services firm Unchained said quantum computing poses a long-term risk to Bitcoin, not an immediate one, noting that today’s quantum machines remain far below the capability needed to break the network’s cryptography.

    IBM did not immediately respond to a request for comment by Decrypt.

  • Lido’s community staking module sharpens its edge with DVT clusters

    Lido’s community staking module sharpens its edge with DVT clusters

    Lido’s new IDVTC design lets verified solo stakers form DVT clusters, slashing collateral needs while hardening Ethereum validator risk and sustaining staking yields.

    Summary

    • IDVTC groups four verified community stakers into one DVT-backed validator cluster, reducing single-operator failure risk.​
    • Lower collateral becomes viable as DVT makes slashing and downtime tail events instead of structural threats.
    • Launch with CSM v3 in Q2–Q3 2026 positions Lido against rival restaking and LST platforms on resilience instead of raw TVL.

    Lido’s community staking module is about to stop pretending this is still a game for whales only. A new proposal to introduce an “Identified DVT Cluster” (IDVTC) operator type would let verified independent stakers pool into distributed validator clusters, cutting collateral requirements while hardening the protocol’s weakest link: operational risk.

    You might also like: BTC traders brace for $2B liquidation risk as market hovers near key levels

    Under the plan, each IDVTC cluster consists of four independent community stakers, all running validators via Obol or SSV with keys created through distributed key generation (DKG). In practice, that means no single operator can take a validator down, mis‑configure a client, or disappear without the rest of the cluster absorbing the shock. Distributed validator technology (DVT) spreads duties and key shares across multiple nodes, so slashing and downtime events become outliers instead of structural risk.​

    Because the risk profile improves, Lido can justify lowering collateral requirements for these operators. That is the capital-efficiency play: you move from over‑collateralized, quasi‑professional setups to leaner independent operators whose main constraint is competence, not balance sheet size. For Lido, this broadens the operator base without opening the door to pure anon fly‑by‑night nodes, since IDVTC membership is restricted to verified Independent Community Stakers (ICS) who pass onboarding checks.​

    Timing matters. The IDVTC feature is targeted for launch with CSM v3 in Q2–Q3 2026, squarely into the next phase of Ethereum’s staking cycle and a more competitive liquid staking market. Restaking, AVSs and competing LSTs are already bidding for the same underlying validator set. Bring down collateral, keep slashing risk contained, and you have a better story for decentralization and yield sustainability than “more TVL, same handful of operators.”​

    If executed, IDVTC pushes Lido closer to a model where independent stakers look more like a distributed credit book: risk‑tiered, clustered, and modular. For investors, the signal is simple: Lido is trying to buy resilience and decentralization with better engineering instead of higher issuance. In a market where basis trades and ETF flows are already compressing staking spreads, that is the only credible way to keep the yield machine running without blowing up the tail risk.

    Read more: Ethereum price prediction $2.8K as bulls defend key levels and $1.8B in long liquidations

  • Etherfuse Launches Low-Cost Dollar-Peso FX

    Etherfuse Launches Low-Cost Dollar-Peso FX

    Etherfuse, a blockchain infrastructure company focused on tokenized bonds, has launched Etherfuse FX, a new platform for fast currency conversion between US dollars and Mexican pesos. The company says the system can reduce conversion costs by up to 90% for businesses that regularly move money between the United States and Mexico.

    For Mexican peso exposure, the system uses tokenized CETES, short-term government treasury bonds issued by Mexico. According to the company, this structure is designed to provide the type of asset backing familiar to institutional finance while improving transaction speed and efficiency.

    The solution is aimed at companies that frequently work with multiple currencies. This includes remittance services, payment processors, B2B software providers, and import-export businesses operating between the US and Mexico.

    Businesses can connect to Etherfuse FX through standard APIs that integrate with existing payment and accounting systems. The company says most integrations can be completed within two to three weeks.

    Image: Freepik

  • ShapeShift founder Erik Voorhees doubles down on Ethereum with $49M investment: Onchain data

    ShapeShift founder Erik Voorhees doubles down on Ethereum with $49M investment: Onchain data

    ShapeShift founder and Bitcoin pioneer Erik Voorhees is continuing his Ethereum buying spree after restarting purchases following a year-long break.

    According to on-chain data tracked by Lookonchain, Voorhees on Sunday spent around $49 million acquiring 23,393 $ETH. He still holds over 35 million $USDT and is expected to buy more $ETH.

    Erik Voorhees(@ErikVoorhees), an early #Bitcoin supporter and founder of ShapeShift, is buying $ETH like crazy after a one-year break!

    He spent 49.08M $USDT to buy 23,393 $ETH at $2,098 through 2 wallets.

    He still holds 35.25M $USDT and may buy more $ETH.… pic.twitter.com/18ifLc8Ghe

    — Lookonchain (@lookonchain) March 16, 2026

    The prominent entrepreneur, who also founded Venice AI, reportedly resumed his $ETH purchases earlier this year after selling 12,886 $ETH at over $3,300 each.

    Erik Voorhees(@ErikVoorhees), an early #Bitcoin supporter and founder of ShapeShift, is buying back $ETH after a one-year break.

    One year ago, he sold 12,886 $ETH($42.83M) at $3,324.

    In the past 5 days, he has spent 17.75M $USDT to buy back 8,576 $ETH at $2,069.

    He still holds… pic.twitter.com/zTD1DdU6WU

    — Lookonchain (@lookonchain) March 15, 2026

    The activity was linked to wallets believed to be controlled by Erik Voorhees and labeled as such by Arkham Intelligence. He has not confirmed that he controls them.

    The latest transfers came as $ETH surpassed $2,200, representing a 7% increase in the last 24 hours, CoinMarketCap data shows.

    The crypto market rallied over the weekend, pushing total market capitalization up about 3% to $2.5 trillion. Bitcoin advanced 2.5% to retake $73,500.

    Disclosure: This article was edited by Vivian Nguyen. For more information on how we create and review content, see our Editorial Policy.

  • Metaplanet secures $255M, targets $531M total raise to buy more Bitcoin

    Metaplanet secures $255M, targets $531M total raise to buy more Bitcoin

    Metaplanet, the Tokyo-listed investment firm pursuing a Bitcoin-focused treasury strategy, has raised approximately $255 million from global institutional investors as it advances its long-term Bitcoin accumulation goal.

    According to CEO Simon Gerovich, the company may receive up to $276 million more if certain warrants are exercised, giving total potential funding of around $531 million to support its plan to accumulate 210,000 $BTC.

    Metaplanet has raised ~$255m from global institutional investors via a placement of new shares priced at a 2% premium, paired with fixed-strike warrants at a 10% premium that monetize our equity volatility for up to ~$276m in additional capital upon exercise. Up to ~$531m in… pic.twitter.com/0tg62TopGR

    — Simon Gerovich (@gerovich) March 16, 2026

    Metaplanet currently holds 35,102 $BTC, valued at approximately $2.6 billion at current market prices. This positions the company as the third-largest Bitcoin treasury globally, trailing only Strategy and MARA Holdings, which together hold 792,553 $BTC.

    Strategy, the largest crypto treasury firm, is expected to announce a new Bitcoin acquisition today, following hints from Executive Chairman Michael Saylor and last week’s preferred share sale that raised additional funds.

    Metaplanet targets holdings of 100,000 $BTC by the end of 2026 and 210,000 $BTC by the end of 2027.

    As part of its expansion plans, the firm intends to establish a US subsidiary, Metaplanet Asset Management, to support venture investments and develop digital asset financial services linked to Bitcoin capital markets.

    Disclosure: This article was edited by Vivian Nguyen. For more information on how we create and review content, see our Editorial Policy.

  • Bitcoin briefly tops $74,000 as ether, sol, ada gains as much as 6% in Monday surge

    Bitcoin briefly tops $74,000 as ether, sol, ada gains as much as 6% in Monday surge

    Bitcoin briefly broke through the $74,000 resistance zone that it had rejected four times in two weeks, before reversing under that level.

    The largest cryptocurrency was trading just above $74,000 on Monday morning, up 2.9% over the past 24 hours and 9.7% on the week. Ether surged 7.7% in 24 hours and 14.3% on the week to $2,261, its strongest weekly performance in months. Solana jumped 5.6% on the day and 12% on the week to $93.

    Dogecoin hit $0.10 for the first time since early March, up 4.6% daily and 10.6% weekly. BNB gained 3.8% to $683 with a 9.5% weekly gain. XRP rose 4.2% to $1.47, up 8.9% over seven days.

    The move had a short squeeze behind it. CoinGlass data shows $344 million in total liquidations over the past 24 hours across 91,978 traders, with short liquidations accounting for $284.9 million, roughly 83% of the total. Ether shorts got hit hardest at $127.9 million, followed by bitcoin at $124.5 million and solana at $18.5 million.

    The largest single liquidation was a $6.94 million BTC position on Bitfinex. The lopsided ratio confirms that the rally was fueled in part by bears getting forced out of positions, though the broad altcoin participation and macro backdrop suggest there’s more to it than just a squeeze.

    The catalyst was a shift in tone from multiple directions at once. Trump said the U.S. was talking to Iran, though Tehran denied requesting talks or a ceasefire. Iranian Foreign Minister Abbas Araghchi said the Strait of Hormuz was only closed to ships from “enemies,” a notable softening from the blanket closure that had been in effect.

    Two tankers carrying liquefied petroleum gas to India sailed through the strait on Sunday, the first commercial transit since the war began.

    Oil reflected the change in mood. Brent traded around $104 after earlier climbing as high as $106.50 following the Kharg Island strikes, but pulled back as the Hormuz headlines hit. WTI dropped below $100. The dollar weakened 0.3%. S&P 500 futures advanced 0.5%, set for their first gain in five days. MSCI’s global equity gauge stabilized after three days of declines.

    For crypto, the combination of easing oil, a weaker dollar, and even a hint of de-escalation is the exact macro cocktail that loosens the liquidity chain that has been choking risk assets since the war began.

    The weekly numbers are the most impressive since before the war. Bitcoin’s 9.7% gain is strong but the altcoin outperformance is the signal that risk appetite is genuinely returning. When ether outperforms bitcoin by 4.6 percentage points and solana outperforms by 2.3 points on a weekly basis, capital is rotating down the risk curve rather than hiding in bitcoin.

    The Fed meeting on March 17-18 arrives with different context than it had a week ago.

    Oil is still elevated but the Strait of Hormuz showing signs of reopening changes the inflation calculus. The dot plot and Powell’s press conference on Wednesday will determine whether the market’s rate cut hopes survive or get crushed.

  • XRP climbs 3% past $1.47 as breakout extends on broad bitcoin-led move

    XRP climbs 3% past $1.47 as breakout extends on broad bitcoin-led move

    $XRP pushed higher after clearing a key resistance level, extending a breakout from a multi-month consolidation range.

    News Background

    • $XRP’s latest move comes after several months of sideways trading, where the token repeatedly failed to sustain rallies above the mid-$1.40 area.
    • The breakout marks the first clear move above that ceiling since early 2026, shifting short-term momentum toward buyers.
    • While the price advance lacked a clear $XRP-specific catalyst, activity on the $XRP Ledger has continued to rise.
    • Tokenized real-world assets on the network recently climbed sharply, with the value of tokenized commodities approaching $1.14 billion during the first quarter.

    Price Action Summary

    • $XRP rose from about $1.41 to $1.47 during the latest 24-hour session
    • The token broke through the $1.426 resistance zone that capped previous rallies
    • Trading volume spiked to roughly 170 million tokens during the breakout
    • $XRP traded within a roughly 5% intraday range

    Technical Analysis

    The key development was the breakout above $1.426, which had acted as a ceiling throughout recent consolidation. Once the level cleared on strong volume, price accelerated quickly toward the $1.47 area.

    Short-term charts show a sequence of higher lows forming after the breakout, suggesting buyers are attempting to turn the former resistance zone into support.

    Momentum remains constructive while $XRP holds above roughly $1.43. The next technical barrier sits near the $1.48–$1.50 area, where previous rallies have stalled.

    What traders say is next?

    Traders are now focused on whether $XRP can maintain support above the $1.43–$1.44 breakout level.

    If that zone holds, the token could extend the move toward $1.50 and potentially the $1.55 region as momentum builds.

    However, a drop back below $1.43 would weaken the breakout and could pull $XRP back toward the previous consolidation range near $1.39–$1.40.

  • Crypto Market Review: Where Did XRP’s Volatility Go? Bitcoin (BTC) $72,000 Break Is Not What You Think It Is, Did Shiba Inu (SHIB) Reach Top? Price Below $0.000006

    Crypto Market Review: Where Did XRP’s Volatility Go? Bitcoin (BTC) $72,000 Break Is Not What You Think It Is, Did Shiba Inu (SHIB) Reach Top? Price Below $0.000006

    The recent price movement of most assets on the market exists with almost no volatility. Momentum has disappeared, as assets are currently trading in a tight consolidation range near local resistances after months of violent swings and abrupt directional changes.

    After a protracted downtrend that started after its peak above $3 earlier in the cycle, the larger chart structure shows $XRP stabilizing. Price has been progressively forming higher lows along an ascending support line since the dramatic decline in early February, indicating that sellers are losing some of their dominance.

    $XRP‘s volatility compression

    But the compression in volatility is what really sticks out. In contrast to the sharp swings observed earlier in the year, $XRP has been trading within an ever-tinier price range, with daily candles drastically contracting. When the market reaches a brief equilibrium between buyers and sellers, this kind of volatility collapse frequently takes place.

    Technically speaking, $XRP is still below a number of important moving averages, such as the 26-day and 50-day exponential moving averages, which continue to serve as resistance levels. The asset has made several attempts to recover these indicators, but it has not been able to generate enough momentum to maintain a breakout thus far.

    Article image

    Usually, this lack of volatility indicates that there is growing pressure on the market to make a bigger move. Traders frequently wait for a catalyst before making a directional move when the price compresses beneath resistance while maintaining higher lows. This phenomenon is known as a coiling effect.

    Thus, the ascending support structure that is currently developing around the $1.35-$1.40 area is crucial. The market may eventually witness a breakout attempt toward $1.50 and possibly $1.70, where the next significant resistance zone is located, if $XRP keeps honoring this support while moving closer to the moving averages above.

    However, downward movements can also be preceded by volatility compression. The asset may return to the $1.20-$1.30 range, where earlier buyers intervened, if $XRP is unable to overcome overhead resistance and instead loses its ascending support structure.

    Bitcoin’s breakout is irrelevant

    Although Bitcoin has managed to move slightly above the $72,000 mark, the move might not be as positive as it first seems. The breakout currently lacks volume and volatility, two crucial components that usually indicate strong market momentum, despite the psychological significance of regaining this price zone.

    After recovering from the severe correction that drove prices into the mid-$60,000 range earlier this year, Bitcoin is currently essentially stuck in the $72,000 range, moving sideways. In contrast to earlier breakout attempts, trading activity has remained muted during the recent push above resistance, which took place in comparatively calm market conditions.

    Article image

    After the February sell-off, a rising support structure developed for Bitcoin, which has since recovered technically. Bitcoin is currently testing from below the 26-day EMA, one of the asset’s short-term moving averages, thanks to this rebound.

    The larger technical framework is still brittle, though. The current move’s flaw is that the market as a whole does not support it. Traditionally, a spike in trading volume and increasing volatility have coincided with Bitcoin breakouts above significant psychological levels. These indicators show that traders are actively taking part in the move and that fresh capital is entering the market.

    Right now, that is not taking place. Rather, the price action indicates that, in the absence of significant participation, Bitcoin is drifting slightly higher. Breakouts frequently fail to maintain momentum and can swiftly reverse when they happen in low-volume environments.

    Rest of market is weaker

    The rest of the market usually rises when there is a significant Bitcoin breakout. The fact that many altcoins are still weak and trading below significant resistance levels, however, indicates that the broader ecosystem is not supporting the current BTC move.

    The move above $72,000 might be more of a technical bounce than a real breakout, according to this divergence. For investors, whether Bitcoin can increase market participation will probably determine the next stage. A discernible rise in trading activity and volatility would be necessary for a sustained move higher.

    Shiba Inu’s difficulties

    As the asset falls below the $0.000006 level, Shiba Inu is once again finding it difficult to sustain its upward momentum, raising concerns about whether the most recent attempt at recovery has already lost steam. Investors are wary of the prospect of a significant recovery because $SHIB‘s overall market structure continues to indicate a weak trend, despite a few brief rallies in recent weeks.

    Shiba Inu is currently trading at about $0.0000058 and is still in a protracted downtrend that has lasted for several months. A classic sign that sellers still control the market is the chart’s steady pattern of lower highs and lower lows. Even when $SHIB makes an effort to rebound, the rallies usually end abruptly when the price gets close to resistance levels.

    The situation is still unfavorable technically. The 26-day and 50-day exponential moving averages, which serve as dynamic resistance zones above the current price, are still below $SHIB. The asset has been unable to establish a sustained bullish structure because these moving averages have consistently rejected attempts at recovery.

    The same pattern can be seen in the most recent price movement. After rising from its recent lows, $SHIB momentarily formed a small consolidation triangle, but the breakout lacked enough momentum to move the asset toward stronger resistance zones. Rather, the price quickly resumed its sideways movement after stalling close to the $0.000006 range.

    This kind of behavior frequently indicates fatigue rather than accumulation. A market may not be entering with sufficient strength to buck the current trend if it consistently fails to recover important resistance levels.

    The lack of wider market support is another issue that worries investors. Major cryptocurrencies like Bitcoin have been able to stabilize following recent volatility, but many altcoins like $SHIB are still having trouble gaining traction.

    As of right now, the price staying below $0.000006 indicates that Shiba Inu may have already reached its peak in the current cycle. Investors should exercise caution when anticipating a sustained recovery in the near future unless buyers return with noticeably greater momentum.

  • Bitcoin Advances as Oil Jumps Toward $100 on Further Middle East Strikes

    Bitcoin Advances as Oil Jumps Toward $100 on Further Middle East Strikes

    Bitcoin rose over the weekend as escalating tensions in the Middle East pushed oil prices sharply higher, prompting investors to assess the potential spillover into global markets.

    The world’s largest crypto traded at about $72,950 on Sunday, up roughly 2.5% over the past 24 hours, according to CoinGecko data.

    The move came after a volatile weekend that saw Bitcoin briefly dip toward $70,500 before rebounding as traders digested the latest geopolitical developments.

    With oil markets now focused on the risk of disruptions to energy flows through the Strait of Hormuz, traders across asset classes are watching closely for signs that the conflict could widen and spill into broader financial markets.

    Crude oil jumped roughly 3% on Sunday night, climbing to around $100 a barrel, and marking its highest level since July 2022, as the conflict involving Iran entered its third week following U.S. strikes on military facilities on Kharg Island, a key hub for the country’s oil exports.

    In a post on Truth Social on Saturday, President Donald Trump said U.S. Central Command had conducted “one of the most powerful bombing raids in the history of the Middle East,” targeting military sites on the island.

    Trump said the U.S. had deliberately avoided striking Iran’s oil infrastructure but warned that the decision could change if Iran interferes with shipping through the Strait of Hormuz, a narrow corridor that carries roughly one-fifth of the world’s oil supply.

    Kharg Island handles about 90% of Iran’s oil exports, making it one of the most strategically sensitive pieces of energy infrastructure in the region.

    The price of oil matters for Bitcoin. Higher energy prices and subsequent inflationary spikes complicate the Federal Reserve’s path to further rate cuts, prolonging a higher-for-longer regime and a tightening of global liquidity.

    While developments in Iran have rattled commodity markets, the conflict has largely left broader risk assets relatively steady as of late Sunday evening.

    U.S. equity futures edged higher, with Dow Jones futures rising 0.15%, S&P 500 futures gaining 0.15%, and Nasdaq-100 futures up 0.14% to 24,640.

    Bitcoin’s weekend price action reflected the uncertainty, though its performance since the war began on February 28 has remained resilient, with analysts pointing to a crypto-specific demand rather than a broader macro decoupling.

    Prices briefly climbed above $73,475 late Friday before retreating after the initial headlines around the strikes. The crypto then stabilized through Saturday and Sunday, gradually recovering back above $72,000.

    The rebound suggests crypto traders are weighing geopolitical risks against continued demand for digital assets, though others have warned that further harm to the global economy could result if the war persists.

  • XRP Faces Systematic Rigging, Major Holder Says

    XRP Faces Systematic Rigging, Major Holder Says

    A prominent $XRP holder is calling out what he says is a deliberate and recurring scheme to push the token’s price up before US markets open — then drive it back down once trading begins.

    The claim has split the $XRP community between those who see a coordinated attack and those who say the data points to something far more routine.

    A Chart, A Pattern, And A Name For It

    The community figure at the center of the debate goes by Arthur online. He posted a historical price chart showing $XRP surging toward key resistance levels in the hours before US markets open, then quickly reversing after trading begins.

    He counted nine separate instances of this sequence playing out since February, and says the same pattern has continued into March.

    Arthur did not stop at simply flagging the moves. He attached a name to what he believes is behind them — calling it a possible “new Jane Street playbook,” a reference to the well-known quantitative trading firm.

    🚨 $XRP IS BEING SYSTEMATICALLY MANIPULATED RIGHT NOW

    Pumps straight to key resistance → US market opens → dumps 📉
    Happens over and over.

    Is this the “NEW Jane Street playbook”?

    $XRP down 44% from highs despite MASSIVE @Ripple news, ETF exposure, acquisitions, licenses…… pic.twitter.com/z6gqJwh6Eq

    — Arthur (@XrpArthur) March 13, 2026

    He argued that the sheer number of occurrences, combined with the high volume of leveraged long positions open during each episode, makes coincidence an unlikely explanation.

    What adds weight to his frustration, at least from his perspective, is the broader backdrop. Ripple has made headlines recently with billion-dollar acquisitions and continued ETF inflows.

    Yet despite that activity, $XRP remains roughly 40% below its recent highs. Every time the price tries to break out, sellers appear and push it back down. Arthur sees that as part of the same problem.

    Community Pushes Back On Manipulation Theory

    Not everyone in the $XRP community bought the argument. A trader named Robert W entered the conversation and offered a different read.

    His position was that price moves of this kind tend to repeat across multiple assets when US market liquidity flows in at the open.

    Com’on Arthur. Not everything is manipulation.
    The same pattern appears across multiple assets when US liquidity enters the market.
    Looks more like normal liquidity shifts and profit-taking than a secret “Jane Street playbook”.

    — Robert W. | $XRP Facts & Figures (@RobertXRPFF) March 13, 2026

    Profit-taking and liquidity shifts, he said, are the more natural explanation — not a coordinated institutional strategy.

    Arthur rejected that outright. He pointed to the precision of the pattern: nine occurrences, each following a period of accumulation with a large build-up of long positions.

    Level Of Consistency

    That level of consistency, he insisted, does not happen by accident. He called on several well-known voices in the $XRP space — including Vincent Van Code, Crypto Eri, BankXRP, Digital Perspectives, and Chad Steingraber — to take a closer look at the chart themselves.

    The debate did not stay contained to price action for long. Another participant raised a broader critique of the crypto market, arguing that it runs largely on speculation.

    Featured image from ECS Payments, chart from TradingView