Of the Bitcoins seized, 568.7 $BTC comes from assets confiscated in the Potapenko and Turogin case. The remaining approximately 264.9 $BTC is from seizures related to the Bitfinex attack.
40,285 $BNB were transferred from a separate government wallet. The tokens, worth approximately $31.63 million, were first moved to an unlabeled address and then to a second unknown wallet. The BNBs were reportedly among the assets seized from Alameda Research.
Sending cryptocurrencies to a Coinbase Prime address can, in some cases, indicate preparation for sale. However, exchange-linked addresses can also be used for custody, wallet management, or inter-institutional transfers. Blockchain data alone does not prove that the asset has ultimately been sold.
The US government reportedly holds approximately $27.5 billion in seized cryptocurrency assets. These assets originated from legal seizures, not from market purchases funded by tax revenue.
The Bitcoins transferred to the government under the decree dated March 2025 are intended to be held in the Strategic Bitcoin Reserve. However, the legal status and sales authorization of assets in specific cases may vary. It would be incorrect to interpret the transfer as a definitive sale before an official announcement.
Typical oil futures have a calendar attached to them. The trader buys exposure, the contract moves closer to expiration, and any trader who wishes to remain in the trade needs to roll into another month. This rollover business becomes boring until funds start bleeding due to transaction costs, price spreads, and poor timing of trades.
In effect, Kalshi is saying: Why do this every few weeks or months?
The contract it proposes would make one position last for ten years, while employing a funding strategy that keeps the price tied to the WTI market. For those holding crude exposure over extended periods of time, this may mean simpler mechanics. There will be no need to constantly roll contracts, as well as reduced risks of mistakenly rolling into a physical delivery situation at Cushing, Oklahoma, where the trader had no intentions of taking possession of the barrel of oil.
The company also believes that a single large duration contract would help keep the trading activity in one place instead of spreading liquidity across a long series of expirations.
That idea is arriving at a pretty convenient moment.
The Iran war has turned crude into one of the most aggressively traded macro assets of the year. Hedge funds, institutions and individual traders have all been chasing energy swings as geopolitical headlines keep jerking prices around.
WTI futures have traveled through roughly a $60-per-barrel range since January, which is exactly the kind of environment where traders start caring a lot more about execution, rollover costs and whether their instrument is flexible enough.
The contract would be traded 24 hours a day, Monday through Friday. While the contract would not truly last forever, 10 years is close enough that the average person using it would likely not mind the difference in a regular trade.
There is one problem, however: regulators cannot treat this as an everyday exchange listing.
Derivatives that are perpetual in nature undergo closer scrutiny, so Kalshi cannot self-certify the contract as many exchanges can with other products. The CFTC must review the filing on its own merits.
The filing has come at an inopportune time for CME Group, which recently abandoned its attempt to change the rules of oil trading.
CME backed off, while Kalshi is pushing further
CME had been developing an early version of the contract that would allow for trading 24 hours a day, seven days a week. This proposal was met with stiff opposition from the oil sector and regulatory authorities.
The issue at stake was not just whether the traders wanted to trade oil futures on Saturdays. The physical oil market is priced using benchmark prices, and it was not clear if the non-stop trading could be kept grounded in reality.
The CFTC initially blocked the plan, kicking off months of debate. CME eventually shelved it.
Kalshi is taking a different route. Its market would stop for the weekend, but the contract itself would barely expire at all.
There is also history between these companies. CME executives have criticized perpetual futures, and CME sued the CFTC earlier this year over its decision allowing Kalshi to offer crypto-linked versions of the same broad derivative concept.
And oil is not the only regulatory battlefield surrounding Kalshi.
Ohio, 38 other states, and Washington, D.C. have petitioned the U.S. Supreme Court to take up another separate challenge involving Kalshi’s sports event contracts. In its October 7th filing, Ohio has supported New Jersey in Flaherty v. KalshiEX, LLC., Case No. 26-299.
The matter revolves around whether the sports event contracts qualify as swaps under the Commodity Exchange Act and, if they do, whether the application of federal commodities law preempts state gambling law.
In the Third Circuit, Kalshi prevailed and the sports event contracts were deemed swaps under federal jurisdiction. The Ninth Circuit ruled against Kalshi and held that the application of Nevada’s gaming law remained intact. The Sixth Circuit also disagreed with the proposition that federal commodities law preempted state gambling law.
Other similar challenges are still pending in the Second, Fourth, Seventh, Eighth and Tenth Circuits, as well as the Massachusetts Supreme Judicial Court.
That puts the annualized financing rate at roughly 8% at prevailing rates, charged on the swap exposure and separate from the ETF’s management fee.
The U.S. market now has 593 leveraged ETFs holding more than $256 billion, including 426 funds tracking individual stocks, according to Morningstar Direct data.
Banks have traditionally supplied much of this financing, but tighter capital and risk requirements have created openings for nonbank firms including Ripple Prime, Jane Street and Clear Street.
Ripple launched its Delta One business in August, offering total return swaps tied to U.S. stocks, market indexes and digital assets. It said at the time the operation had more than $1 billion in regulatory net capital, and it had completed a $275 million senior debt offering to help finance further growth.
Meanwhile, the company announced an expanded agreement on Tuesday with hedge fund manager Brevan Howard, under which Ripple Prime will provide brokerage, clearing and financing services across multiple asset classes.
Leveraged ETFs reset their exposure daily, and sharp moves in individual stocks can leave financing firms exposed if a fund’s assets are insufficient to cover losses.
The business gives Ripple fee income tied to stock trading and institutional financing. As such, the company has still not disclosed how much revenue its leveraged ETF financing generates or how much of that activity uses $XRP or the $XRP Ledger.
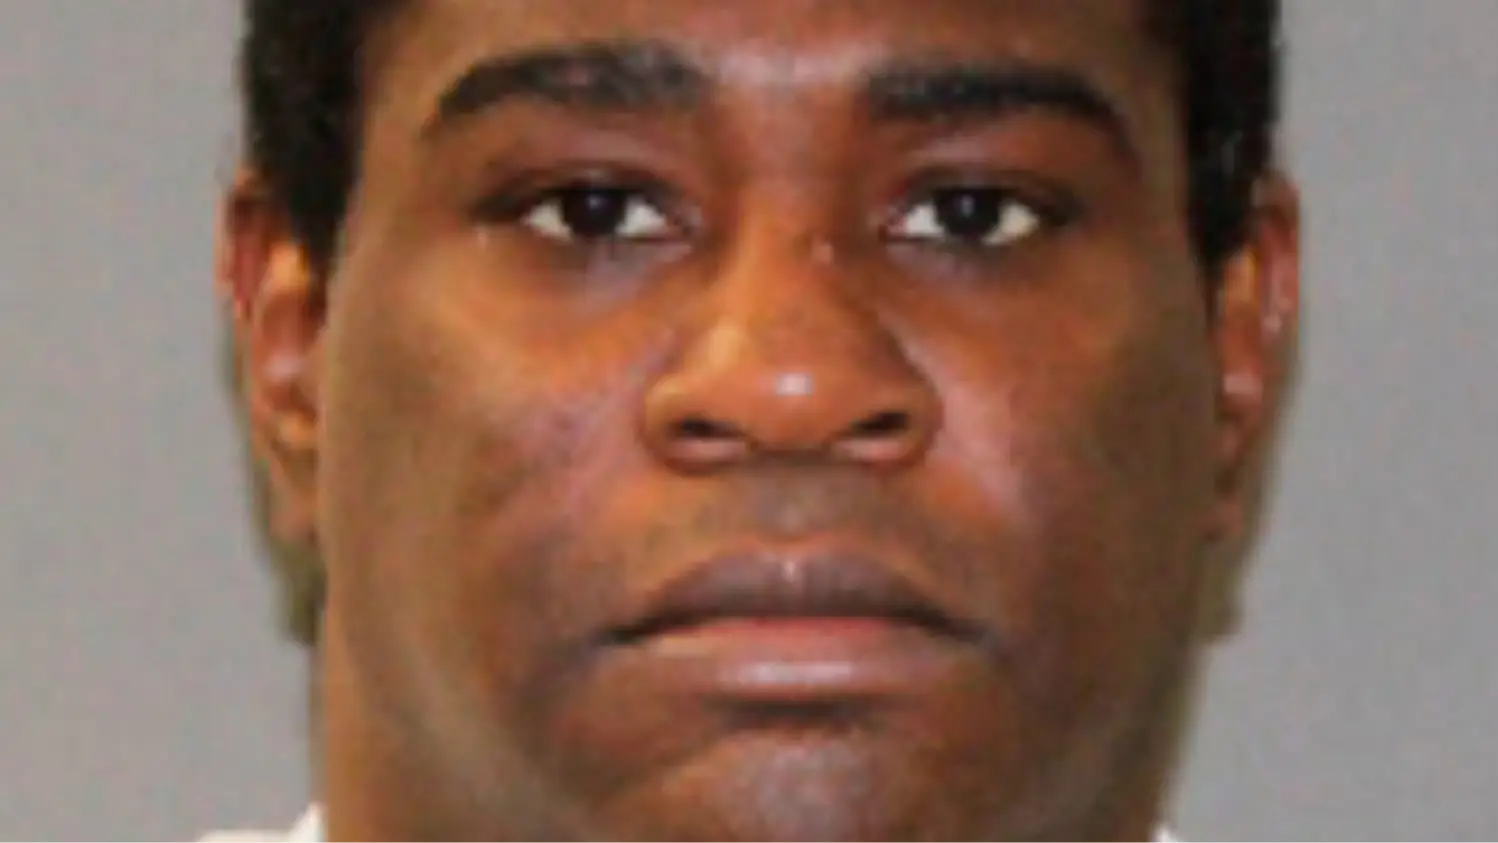
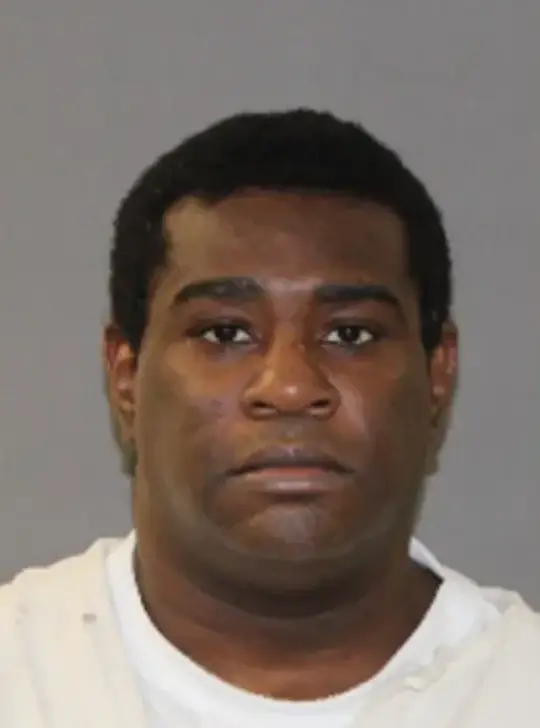
Death row inmate Jamaal Howard has been executed in Texas.
Howard has become the 30th person to be executed in the US this year, and the first since Christa Pike’s failed attempt in Tennessee.
Howard, 46, was pronounced dead at 8.03pm local time after receiving a fatal dose of pentobarbital at the state prison in Huntsville.
He was sentenced to death for the 2000 murder of Vickie Swartout during an attempted robbery.
Howard was said to be ‘chatty’ during the 45-minute journey from death row to the Huntsville Unit where executions are carried out.
Amanda Hernandez, a spokesperson for the Texas Department of Criminal Justice, said: “He made small talk with the officers through the whole trip.”
Once inside, he was taken to a holding cell inside the death chamber, with Hernandez saying: “He was asking questions and was very engaged in the process.”
Jamaal Howard was executed on 7 October (State of Texas 356th Judicial Court)
Earlier today, his legal team had unsuccessfully tried to block the execution, claiming that Howard was intellectually disabled and raising concerns about the use of pentobarbital – the same drug that had been used in Pike’s execution attempt on 30 September.
A One filing from his team read: “Ms. Pike survived two lethal doses of pentobarbital, the same drug used in executions in Texas, and she reportedly remains hospitalised in critical condition.
“When an execution goes wrong, one of the first questions anyone asks is whether the drug was what the State said it was.
“Tennessee’s own officials cannot yet answer that, and the answer lies in records: when the drug was bought, from whom, how it was stored, and what testing was done and when. Texas should not wait until after a failed execution to ask the same questions.
“We do not know why Ms. Pike’s execution failed, and we, specifically, do not know whether the failure was due to the pentobarbital’s being ineffective.”
Howard’s legal team had unsuccessfully tried to block the execution (Texas Department of Criminal Justice)
Jamaal Howard ‘did not understand’ how the execution would work
According to his spiritual advisor Reverend Jeff Hood, at trial, psychiatrists determined that Howard’s IQ is in the the 65-70 range, while they described him as functioning at the level of an 11 or 12-year-old.
Writing in the Texas Observer ahead of the execution, Hood claimed that Howard ‘didn’t understand how executions were carried out’ and that he had not heard of the Pike case or the media storm surrounding it.
He said that when he told Howard that at Pike’s execution the drugs didn’t work, he matter-of-factly replied: “I guess if the drugs don’t work, they’ll just shoot me in the head.”
He said that he told Howard that executions didn’t work like that but claimed he ‘literally had no understanding of the protocol by which he was going to be executed or what would happen if something went wrong’.
It was insisted that Howard didn’t understand how the execution would work (Mike Simons/Getty Images)
An update on Christa Pike following her botched lethal injection
Pike’s legal team have confirmed that she is now ‘conscious and speaking’ following her botched execution attempt last month.
In a new update earlier today, her team said that she could remember her name but when asked the date she still believed it was September.
Dr Joel Zivot, the anaesthesiologist advising her team, shared more details on her condition.
“She has some memories of being in the hospital but no memory, I believe, of the execution attempt,” he told the BBC.
(LADbible)
Tennessee has paused all upcoming executions
In the wake of her execution attempt, Tennessee has announced that all further planned executions be halted until an investigation into the matter is carried out.
A statement issued by the Tennessee Department of Correction said that they ‘followed every step of the State’s lawful, established execution protocol approved by the Attorney General’s Office.’
“The Tennessee Department of Correction followed every step of the state’s lawful, established execution protocol approved by the Attorney General’s Office,” the statement said.
“The lethal injection chemical in the protocol has consistently been effective, and the protocol does not allow for additional procedures beyond what was carried out this evening. Christa Pike has been transported to an off-site medical facility.”
The incident also led to the resignation of Tennessee Department of Correction Commissioner Frank Strada.
Strada will leave his role this month after being the residing commissioner of Tennessee’s Department of Correction for the past three years, and also in the role when the May execution of Tony Carruthers, was called off due to problems finding a vein for his lethal injection.
Jamaal Howard used his final words to apologise to his victim’s family before telling the prison warden he was ‘ready’.
Howard, 46, was pronounced dead at 8:03pm local time after receiving a fatal dose of pentobarbital at Texas’s Huntsville Unit.
He was sentenced to the death penalty for the 2000 murder of Vickie Swartout during an attempted robbery.
Howard, who was 20 at the time, fatally shot store clerk Swartout in the chest before taking $114 and a carton of cigarettes, court documents show.
Once in the chamber, Howard issued a final statement apologising to the family of Swartout.
“I wish that you accept my apology and I wish for your forgiveness,” he said, shortly before the injection got underway.
“I’m sorry for what happened. I wish you can learn to forgive me one of these days.”
He then said to the warden: “Warden, that’s it. I’m ready Warden.”
Jamaal Howard was executed on 7 October (State of Texas 356th Judicial Court)
Prior to being executed, a Texas Department of Criminal Justice spokesperson said Howard had been ‘chatty’ with staff during the 45-minute journey from death row to the Huntsville Unit where executions are carried out.
Spokesperson Amanda Hernandez said: “He made small talk with the officers through the whole trip.”
Once inside, he was taken to a holding cell inside the death chamber.
“He was asking questions and was very engaged in the process,” Hernandez said.
Earlier today, his legal team tried unsuccessfully to have the execution blocked, claiming Howard was intellectually disabled and had a history of mental illness.
At his trial, psychiatrists found that Howard had an IQ in the 65-70 range, and described him as functioning at the level of an 11 or 12-year-old.
In an article published in The Texas Observer ahead of the execution, Howard’s spiritual advisor Reverend Jeff Hood claimed that the inmate ‘didn’t understand how executions were carried out’ and that he was not aware of the Pike case.
Hood wrote that when he informed him about Pike and explained that the drugs hadn’t worked during her execution, Howard replied: “I guess if the drugs don’t work, they’ll just shoot me in the head.”
The Reverend went on to say that he then explained to Howard that executions didn’t work like that but claimed he ‘literally had no understanding of the protocol by which he was going to be executed or what would happen if something went wrong’.
His lawyers also raised concerns about the use of pentobarbital – the same drug that had been used in Pike’s execution attempt on 30 September.
One filing delivered to the court, read: “Ms. Pike survived two lethal doses of pentobarbital, the same drug used in executions in Texas, and she reportedly remains hospitalised in critical condition.
Howard’s legal team raised concerns following the botched execution attempt of Christa Pike (Inside Edition)
“When an execution goes wrong, one of the first questions anyone asks is whether the drug was what the State said it was.
“Tennessee’s own officials cannot yet answer that, and the answer lies in records: when the drug was bought, from whom, how it was stored, and what testing was done and when. Texas should not wait until after a failed execution to ask the same questions.
“We do not know why Ms. Pike’s execution failed, and we, specifically, do not know whether the failure was due to the pentobarbital’s being ineffective.”
In the wake of Pike’s failed attempt, the state of Tennessee announced it was halting all planned executions until an investigation had been carried out.
In a statement released shortly after the botched attempt, the Tennessee Department of Correction said it had followed ‘every step’ of the standard protocol.
“The Tennessee Department of Correction followed every step of the state’s lawful, established execution protocol approved by the Attorney General’s Office,” the statement said.
“The lethal injection chemical in the protocol has consistently been effective, and the protocol does not allow for additional procedures beyond what was carried out this evening. Christa Pike has been transported to an off-site medical facility.”
The aunt of the death row killer who survived her execution Christa Pike has said she believes the failed lethal injections were all part of ‘God’s will’.
In the first interview given by a member of Pike’s family, her aunt Carrie Ross, who helped raise her and ‘loves her like a daughter,’ said she should not have to face execution a second time because ‘the Lord wants her to live’, reports the Daily Mail.
She said, “When God puts his hand on someone, God is in control.
“Not the Department of Correction, not us, but God.”
She revealed that she had not yet been allowed to speak with her niece and neither had her other relatives since she woke up and began to speak after being unconscious since the execution attempt on September 30.
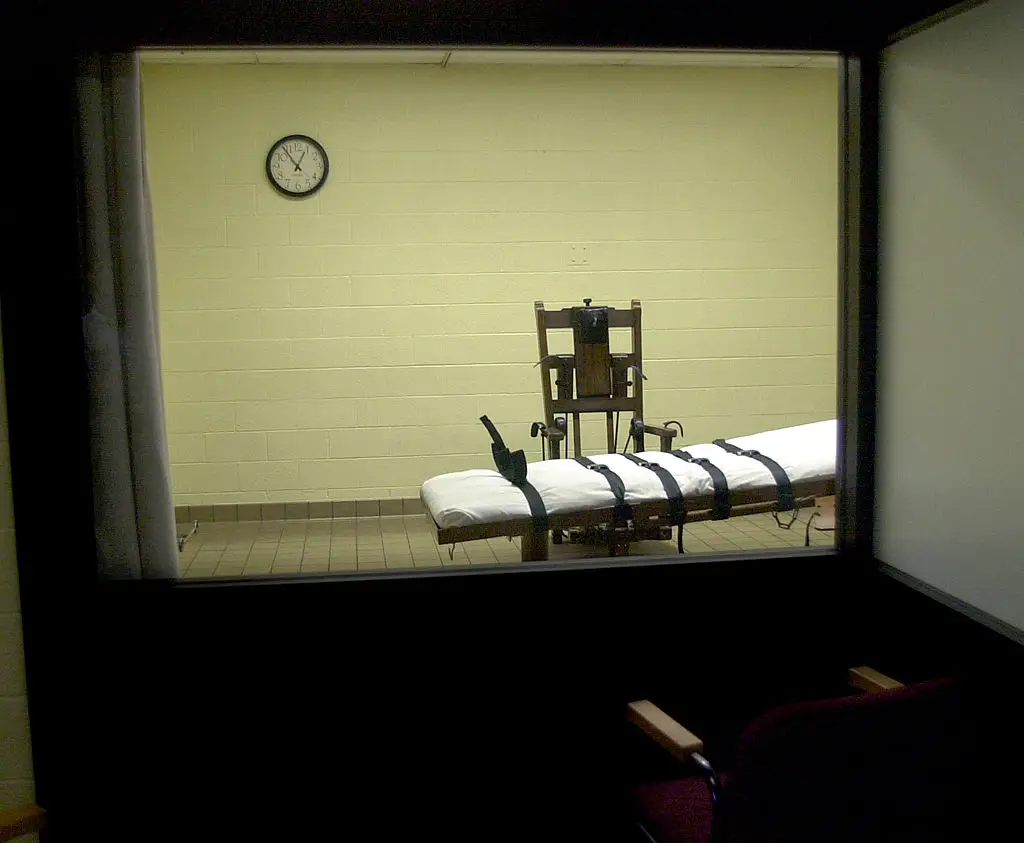
Pike was rushed to hospital after being administered two doses of the lethal poison pentobarbital at Riverbend Maximum Security Institution in Nashville.
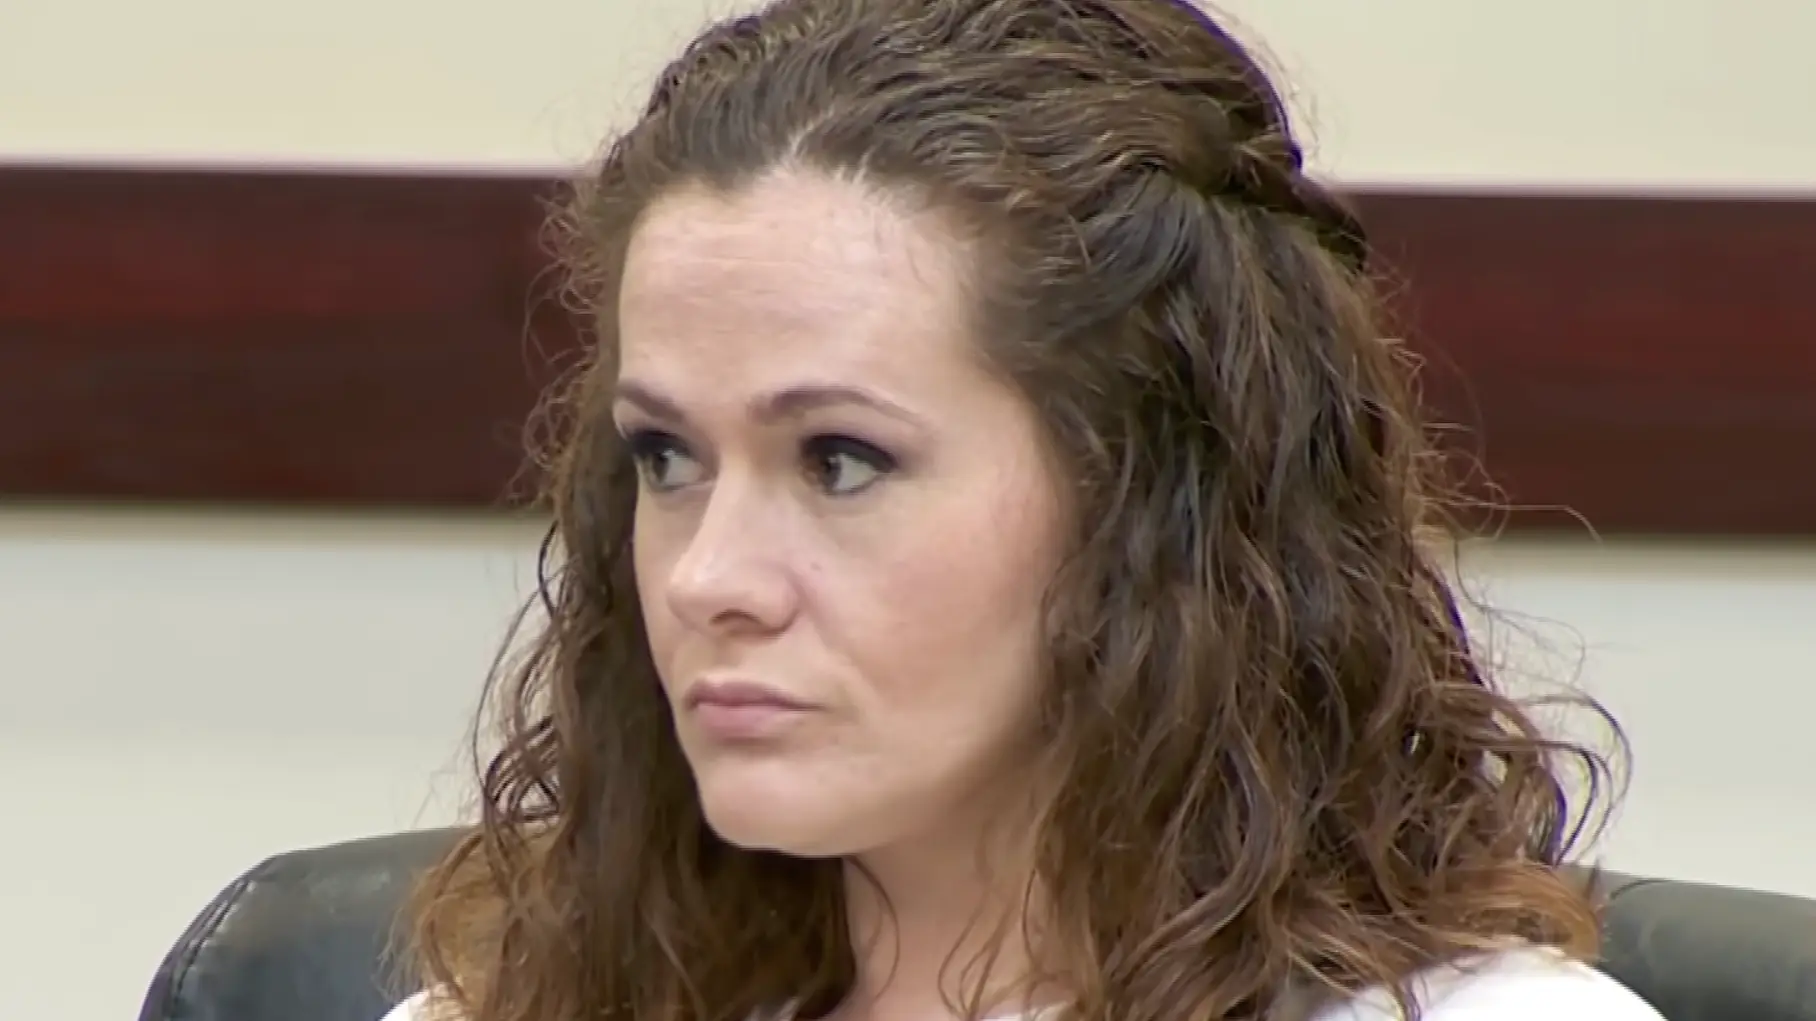
Christa Pike sat in court (YouTube/Inside Edition)
She cannot eat or swallow, and both her arms are swollen, according to statements by her lawyers. She is reported to have blood clots in her arm and is suffering from pneumonia.
Her legal team revealed as recently as Monday they believed Pike was ‘brain dead’ and her life support would be switched off the following day.
However, on Tuesday, to their surprise, instead of being allowed to die, they learned Pike was ‘conscious, speaking’.
Her first words upon waking up were reportedly, “Where am I and who are you?”
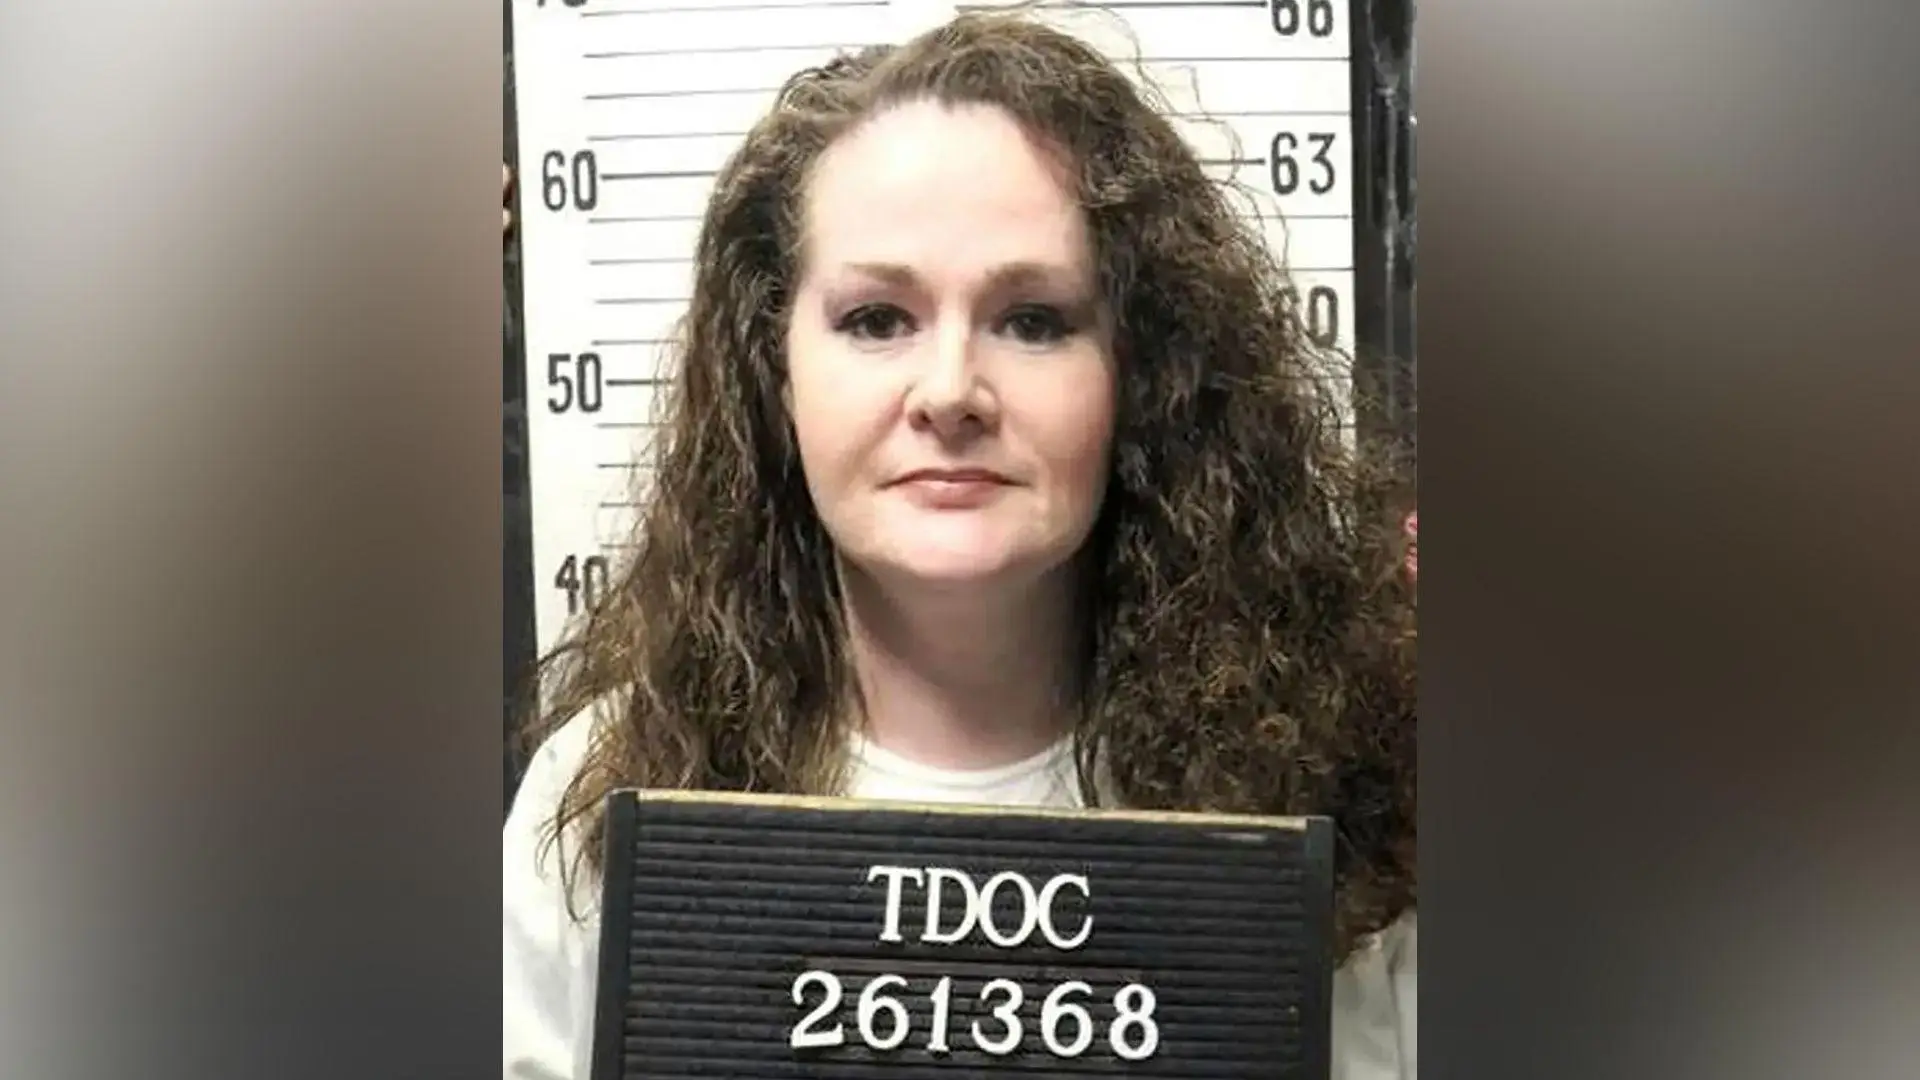
She was due to become the first woman to be executed by Tennessee in over 200 years. Instead, she became the first person to survive execution after actually being given a lethal injection.
“Christa has a long road to recovery,” her attorney Randy Spivey said.
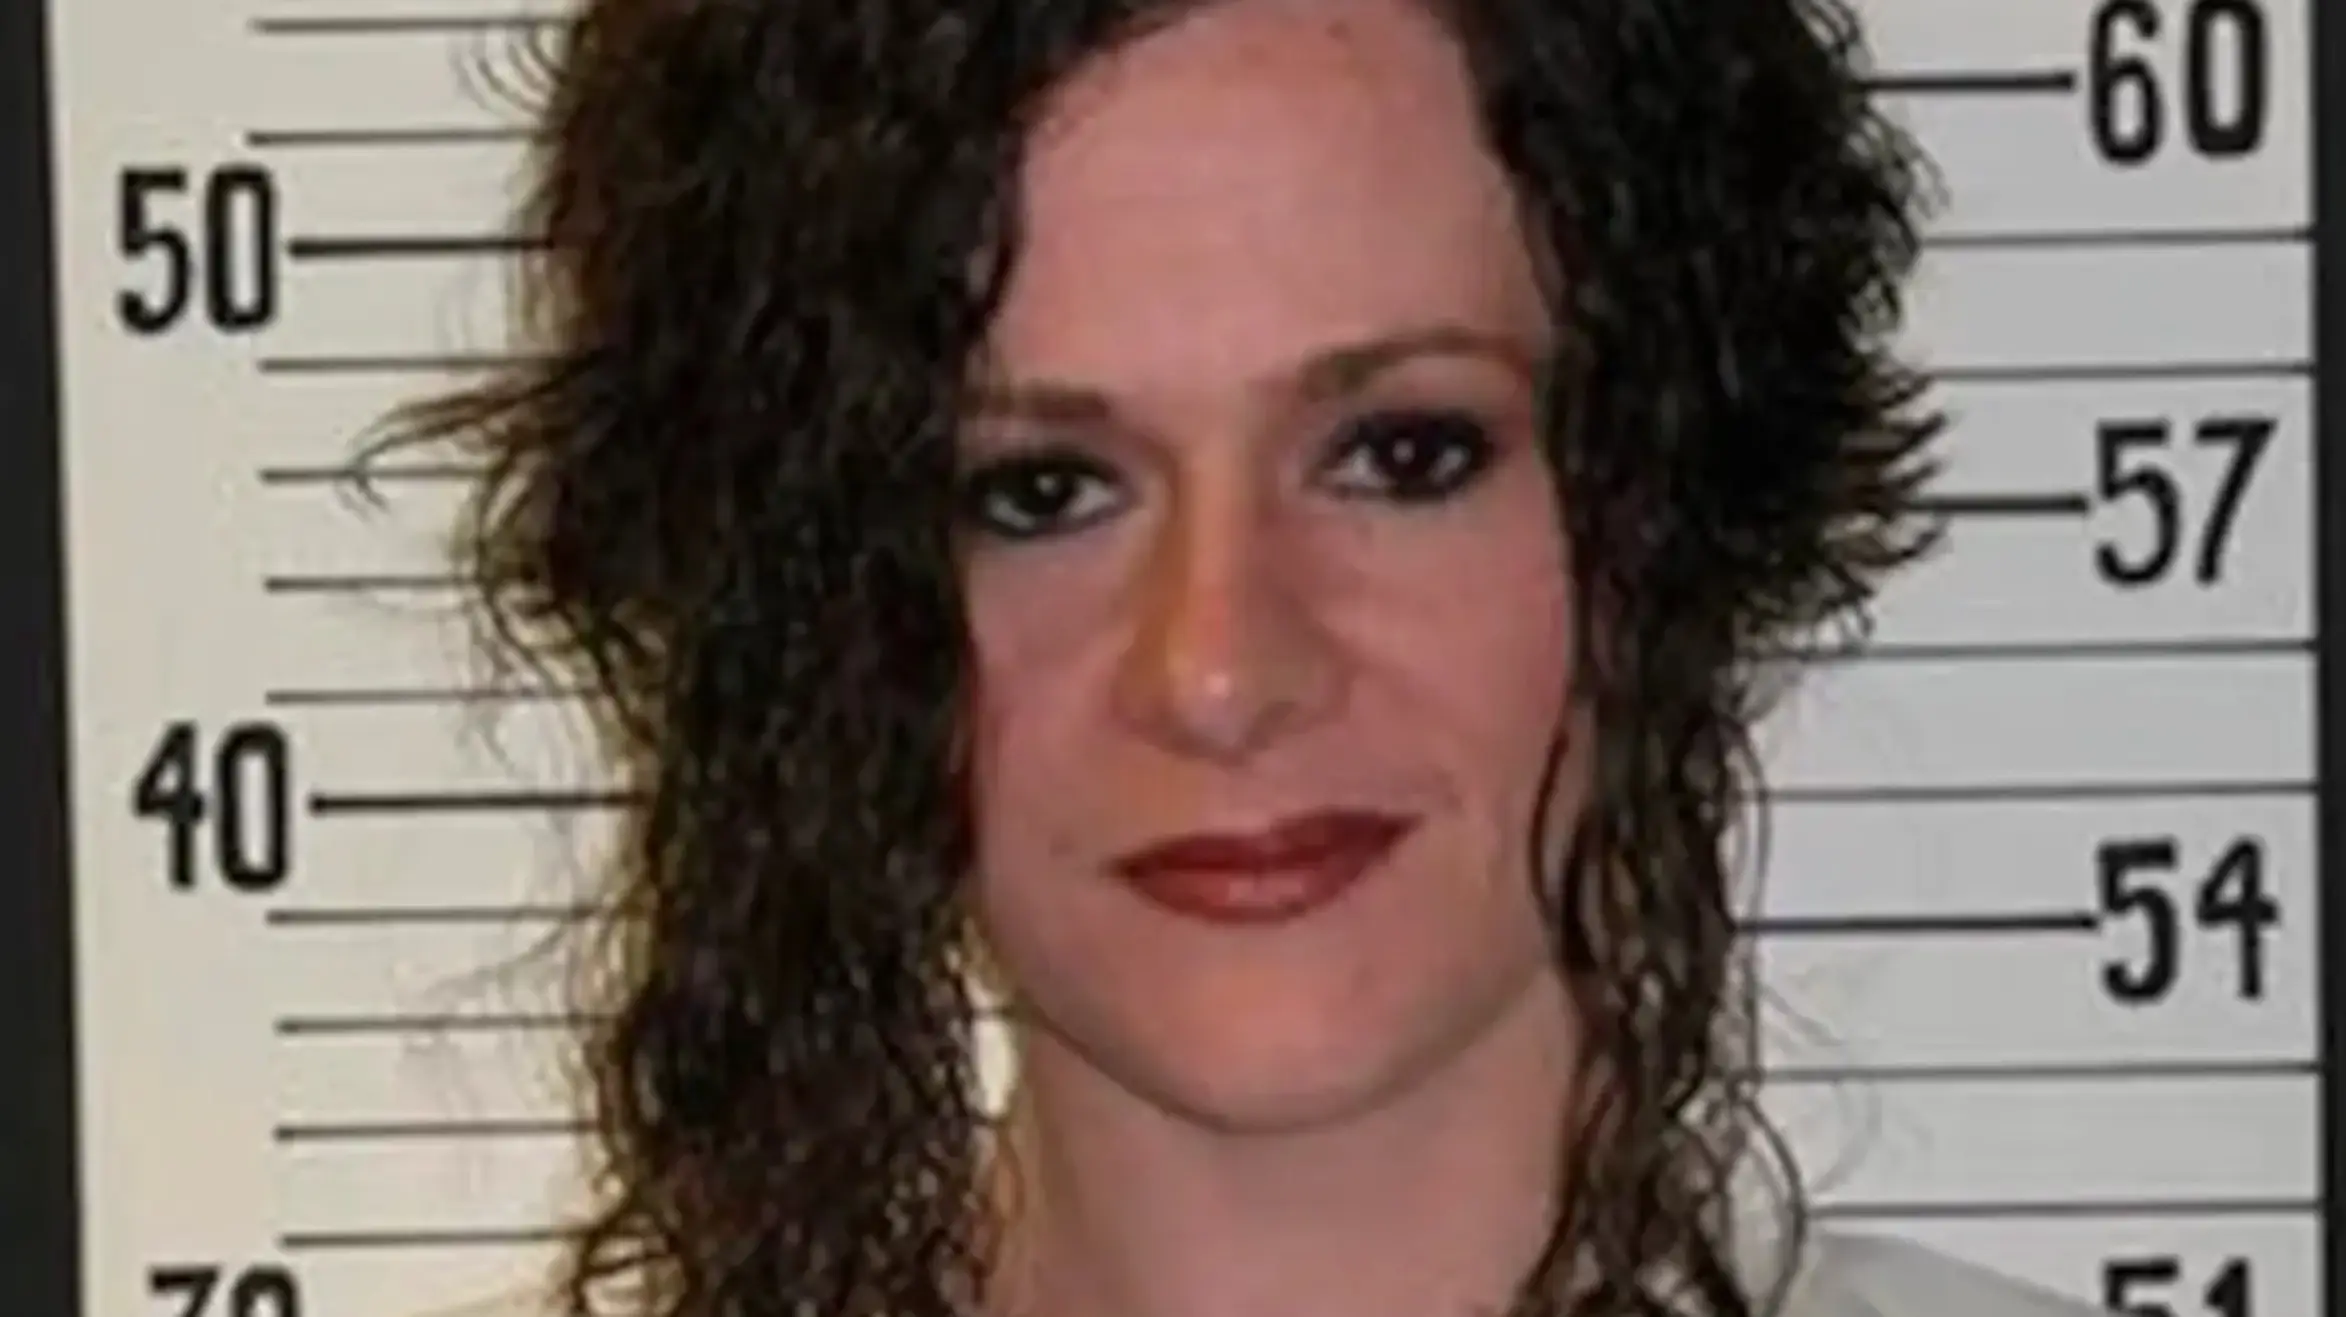
Pike was due to be the first woman executed in Tennessee in over 200 years (Tennessee Department of Correction)
“She has a blood clot in one of her arms, she has pneumonia,” he added. “She is not able to swallow yet, so she has not eaten.”
Spivey said that Pike also suffered ‘extraordinary’ swelling to her hands, adding that they “looked like if you were to blow up a surgical glove.
“I do not have an explanation for what happened between Monday night and Tuesday morning.”
An anaesthesiologist who has advised Pike’s lawyers, Dr Joel Zivot, told the BBC that Pike “has some memories of being in the hospital but no memory, I believe, of the execution attempt.”
“It’s been up, down, up, down. I have cried more tears in the last week than I’ve cried in my whole life,” Ross said.
“This whole week has been a blur.”
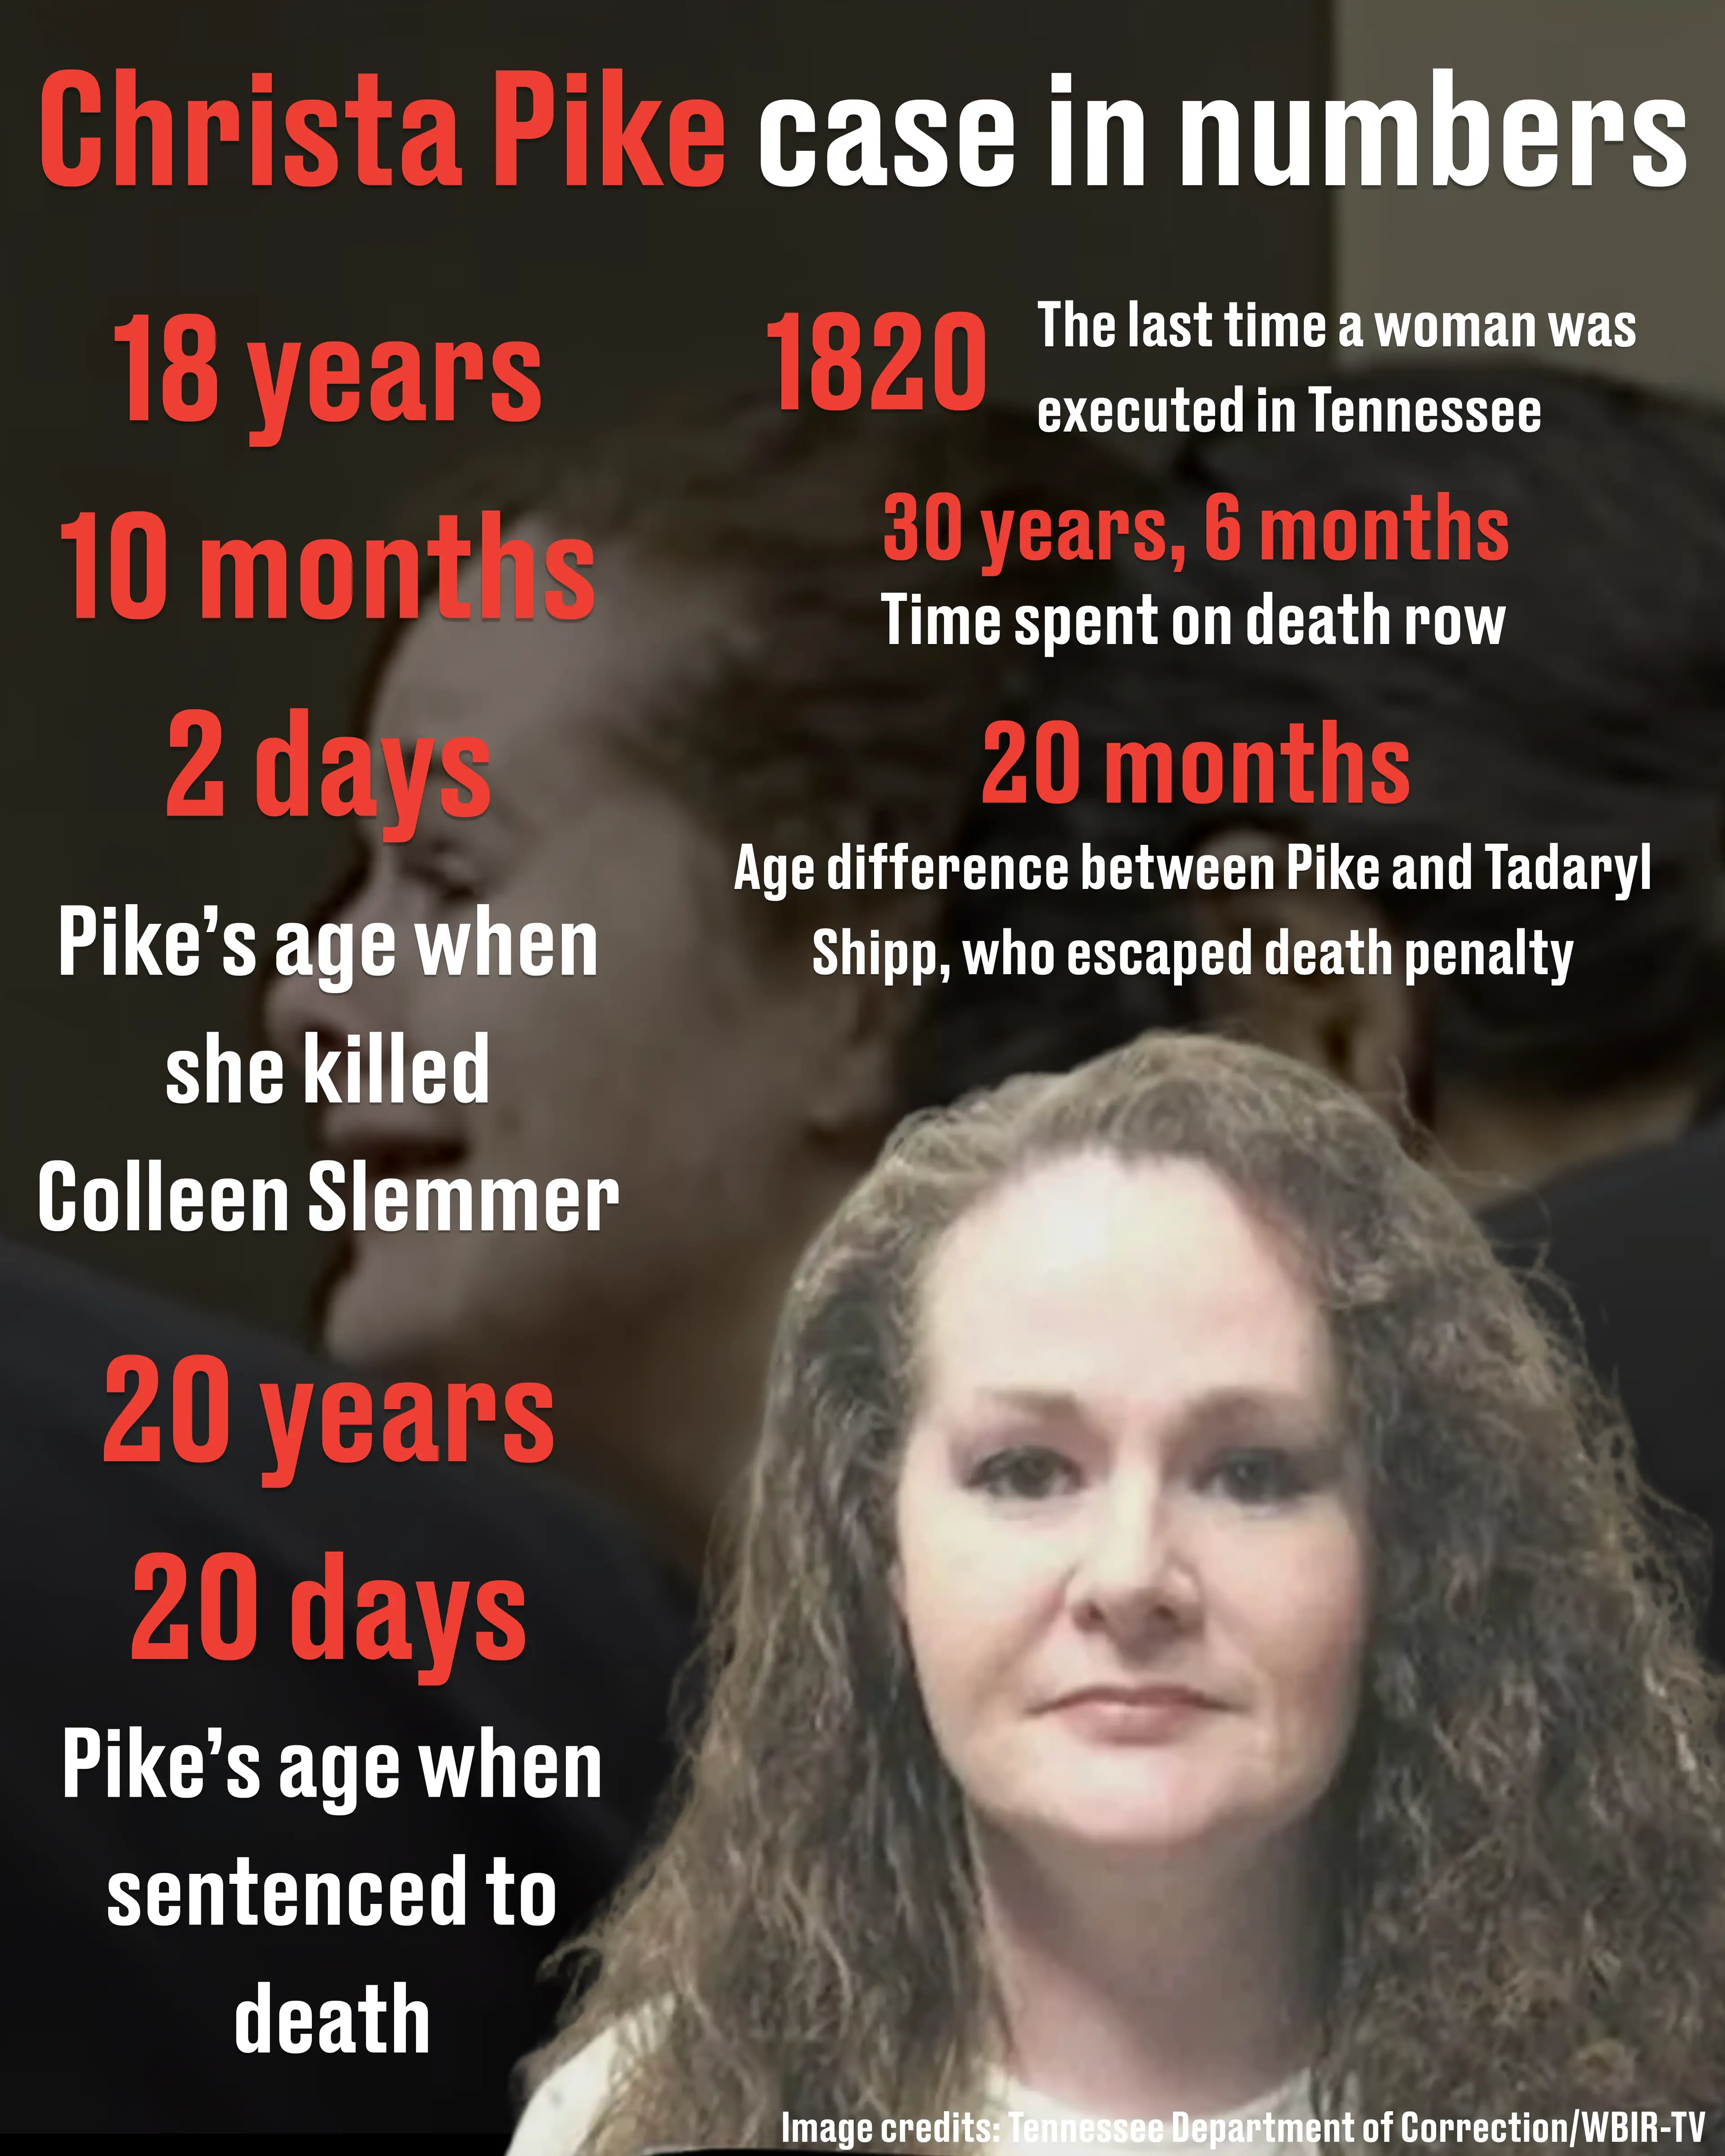
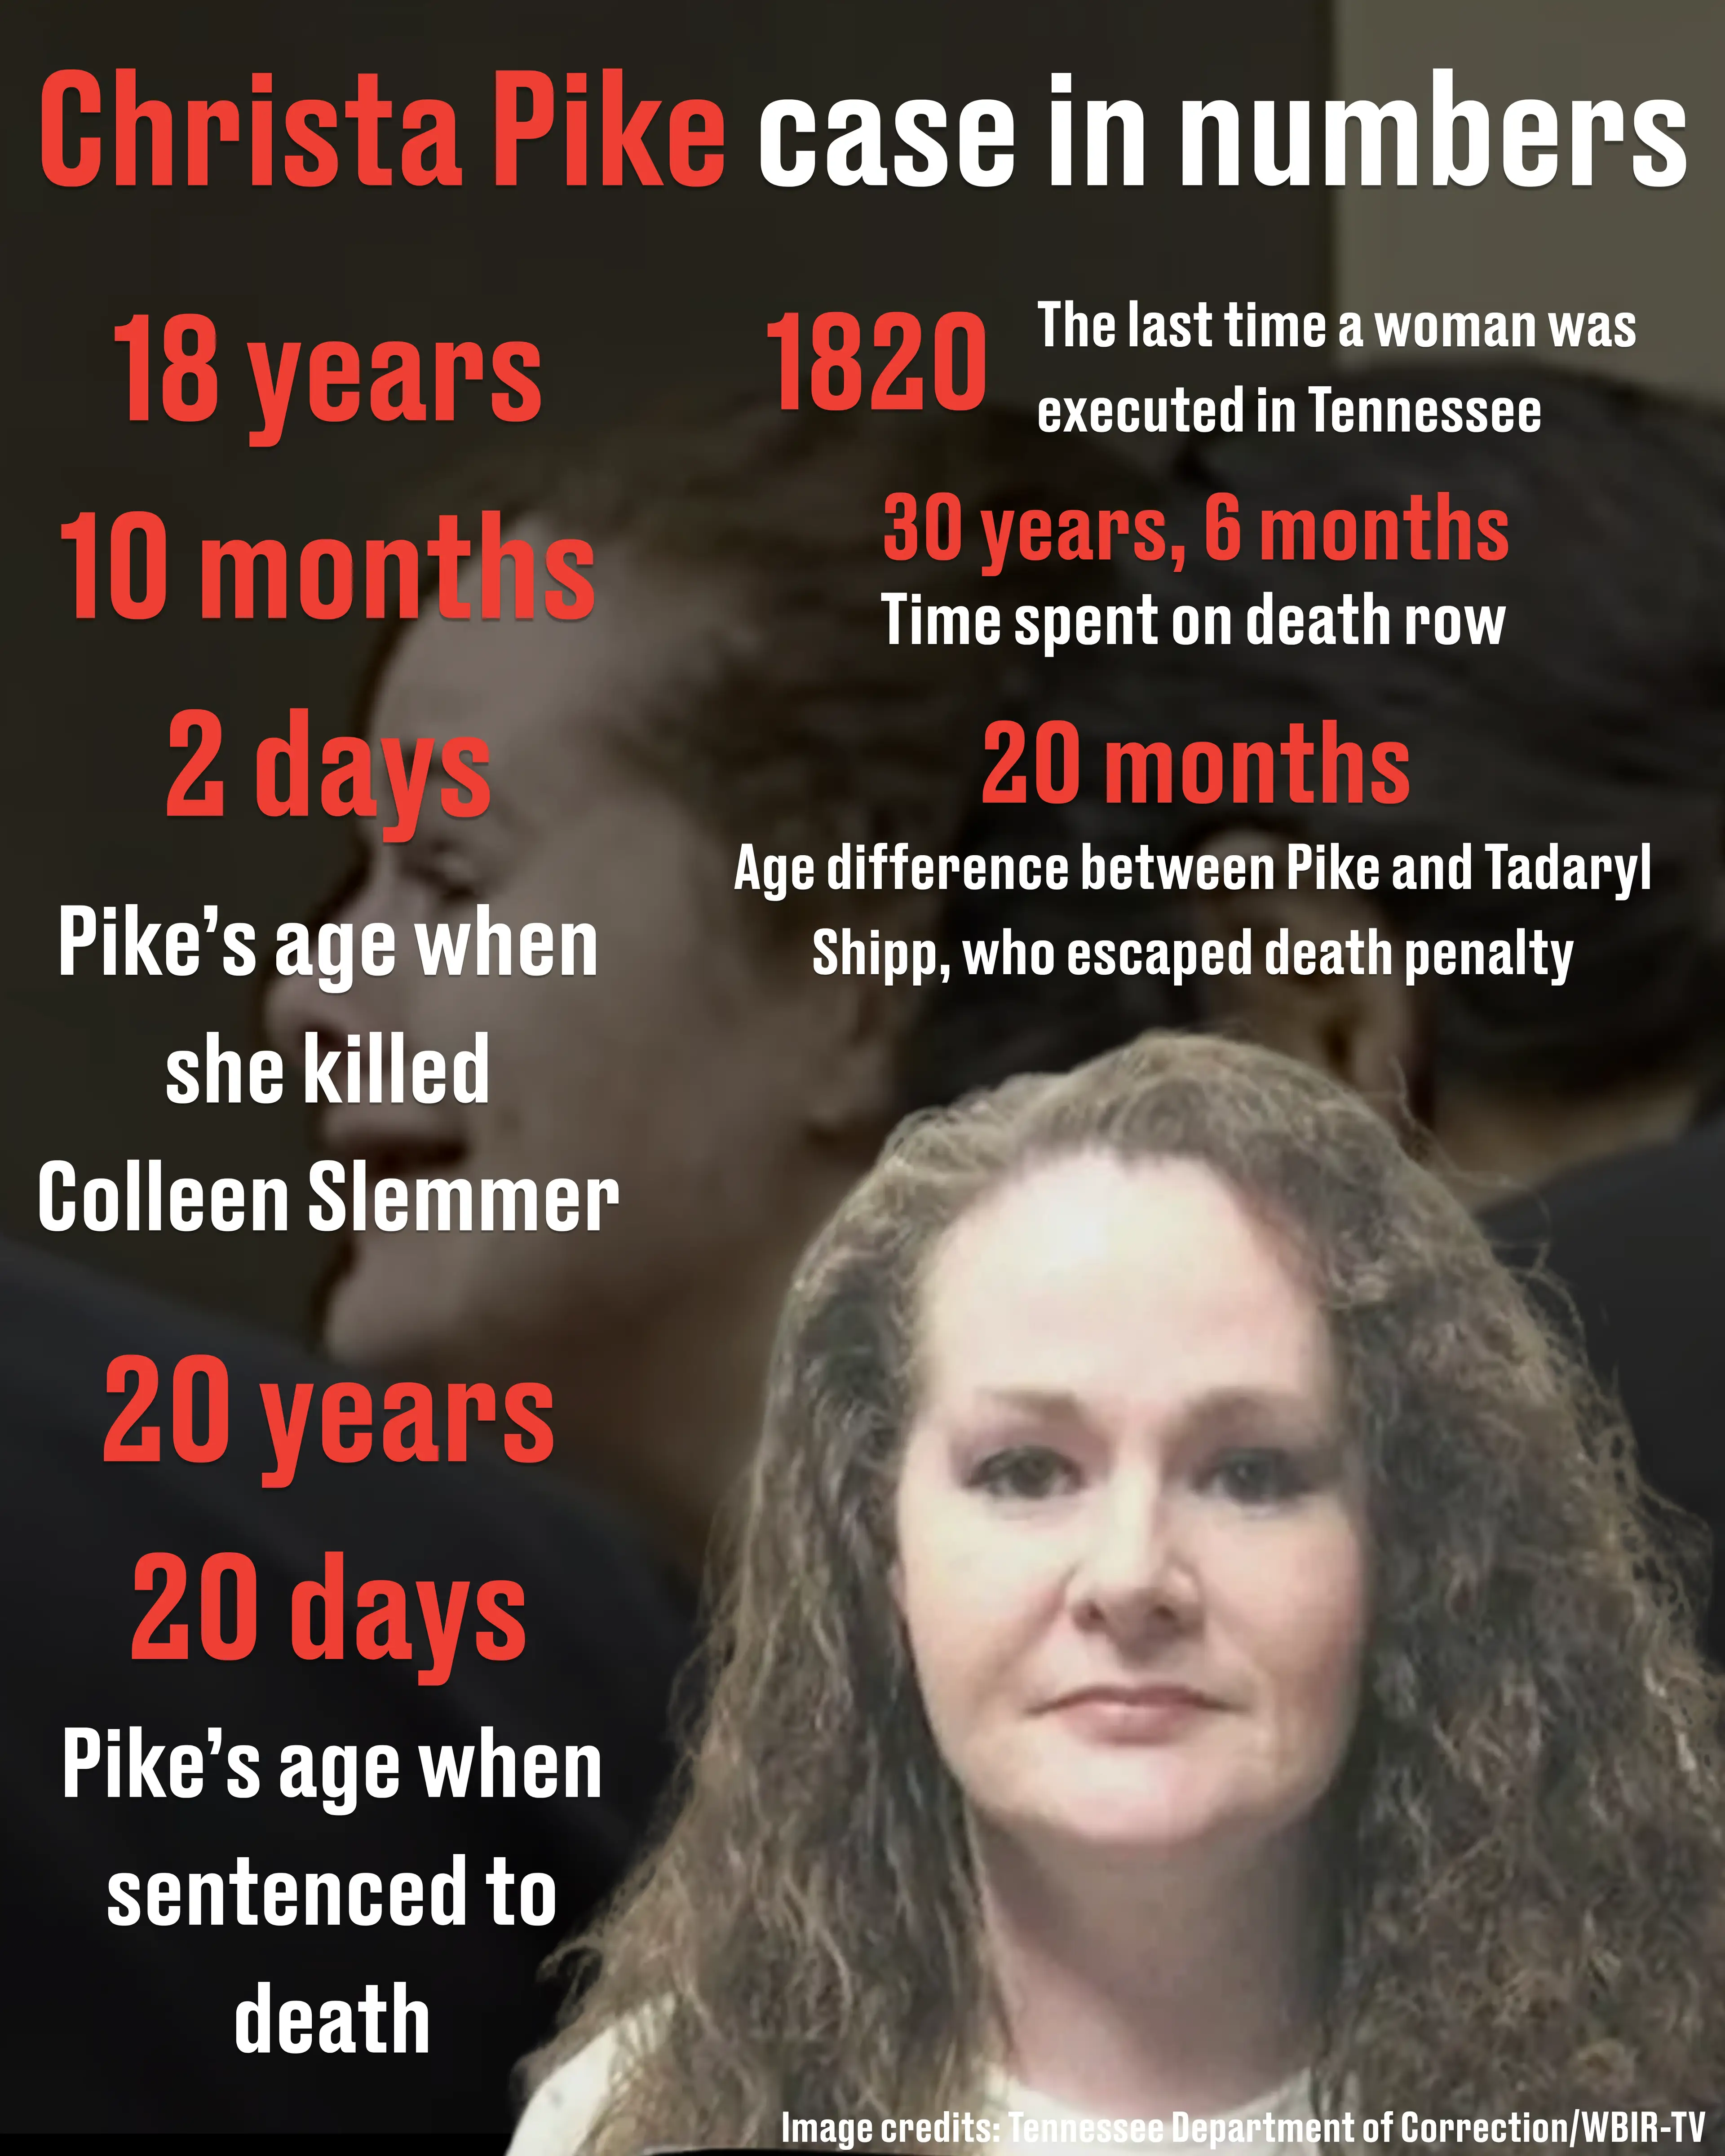
The Christa Pike case in numbers (LADbible/Tennessee Department of Correction/WBIR-TV)
Pike was sentenced to death by a court for the brutal 1995 torture and killing of her classmate Colleen Slemmer in Knoxville.
Pike was 18 at the time and the court which convicted her heard she was in a jealous rage when she committed the murder.
Her aunt argues that Pike’s death sentence should be commuted on the grounds ‘she has suffered enough’ and a second attempt would be ‘torture’.
“That would be horrible. Torture. Don’t do that to a human,” Ross said. “She has completed her execution. She went willingly.”
Bitmine chairman Tom Lee said at Token2049 the company will stop buying Ethereum once it holds 5% of circulating supply.
Bitmine holds 6,016,414 ETH (about 4.9% of supply) and has bought weekly since June 2025, providing steady demand whose end removes a persistent buyer.
The firm sits on roughly $4.5 billion in unrealized losses, having accumulated much of its stash at higher bull-market prices.
Bitmine Immersion Technologies is about to take its foot off the gas. Chairman Tom Lee said the company will halt its Ethereum buying once its holdings reach 5% of the token’s circulating supply, drawing a hard line under one of the market’s steadiest sources of demand.
Speaking Wednesday at the Token2049 conference in Singapore, Lee said the company is roughly 100,000 ETH away from the threshold. At last week’s pace, that’s about six to seven more weeks of accumulation before Bitmine stops.
“We thought this would take five years,” Lee said on stage. “It took us a little over a year. More importantly, we did this all in the middle of a bear market,” he said. “Now we’re going to stop.”
The NYSE-listed firm is the world’s largest Ethereum treasury company, holding 6,016,414 ETH, or about 4.9% of supply, as of its latest disclosure. Bitmine added roughly $41 million in ETH just last week as it closed in on the goal it brands the “Alchemy of 5%.” (Disclosure: Tom Lee is one of several investors in Dastan, Decrypt’s parent company.)
🚨BREAKING: Tom Lee says BitMine will “STOP” buying ETH at 5% “hard cap.”
“We only need to get another 100,000 ETH to get to 5%,” Lee said on stage at Token2049.
The company has bought Ethereum every week since launching its treasury strategy in June 2025, providing a reliable bid that helped underpin the token through a choppy stretch.
That makes the coming stop notable for the broader market. Bitmine’s weekly purchases have been a persistent source of demand, and their end removes a buyer that has absorbed a steady stream of ETH for more than a year.
Lee has previously signaled the company could even sell Ethereum earned through staking to keep its share of supply from drifting above the 5% cap.
BitcoinBTC · USD
$83,252−0.32%
Oct 1Oct 2Oct 4Oct 6Oct 8
$86.8k$85.5k$84.3k$83.0k
24h HighHigh$84,520
24h LowLow$82,823
VolVol$1.8B
Market projectionsOdds by Myriad
→
The milestone arrives with Bitmine deep underwater on paper. Because much of its accumulation happened last year at higher prices during the bull market, the firm’s ETH holdings carry roughly $4.5 billion in unrealized losses, according to tracking data, with Ethereum trading near $2,570 on Wednesday.
Ethereum is down 5.5% today, outpacing losses across most major crypto assets, dropping sharply during Asia trading hours, coinciding with Lee’s remarks.
Still, Lee framed the achievement as a point of pride, having compressed a five-year plan into just over a year. Once the 5% ceiling is reached, Bitmine’s defining buying spree, and the market demand it generated, will come to a close.
Daily Debrief Newsletter
Start every day with the top news stories right now, plus original features, a podcast, videos and more.
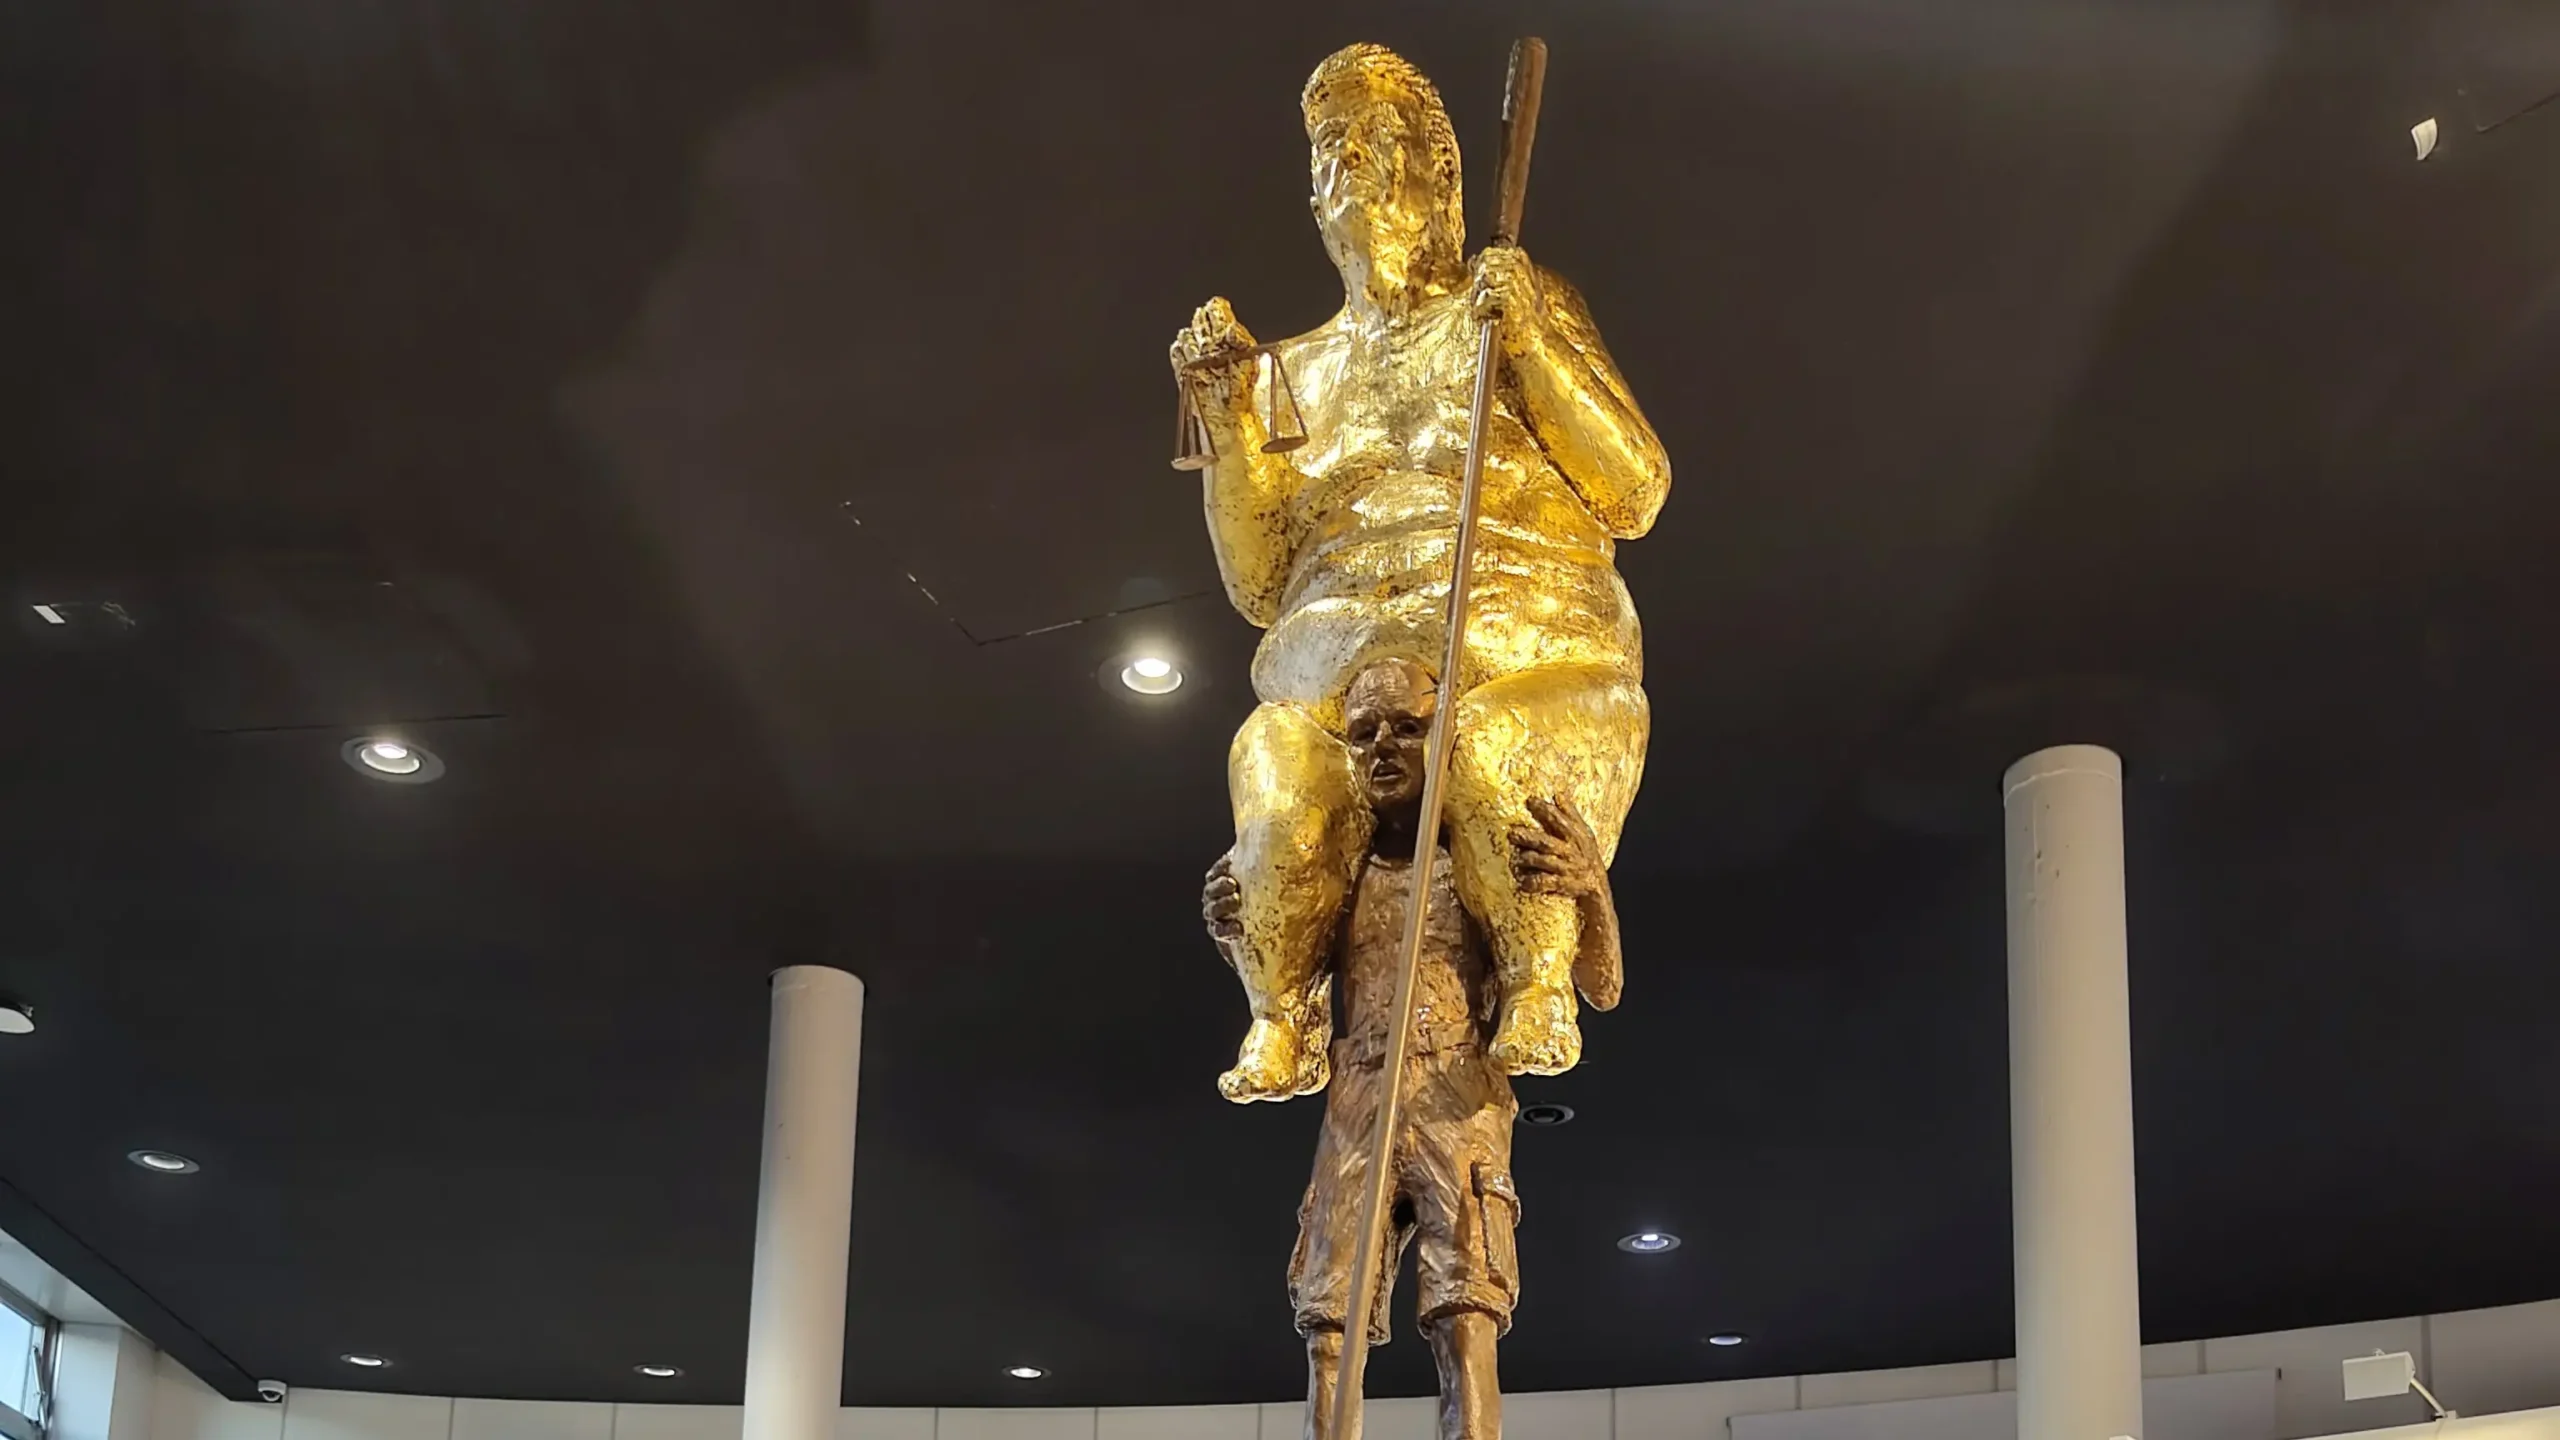
A gold statue of a naked Donald Trump atop the shoulders of another man has been unveiled in Strasbourg.
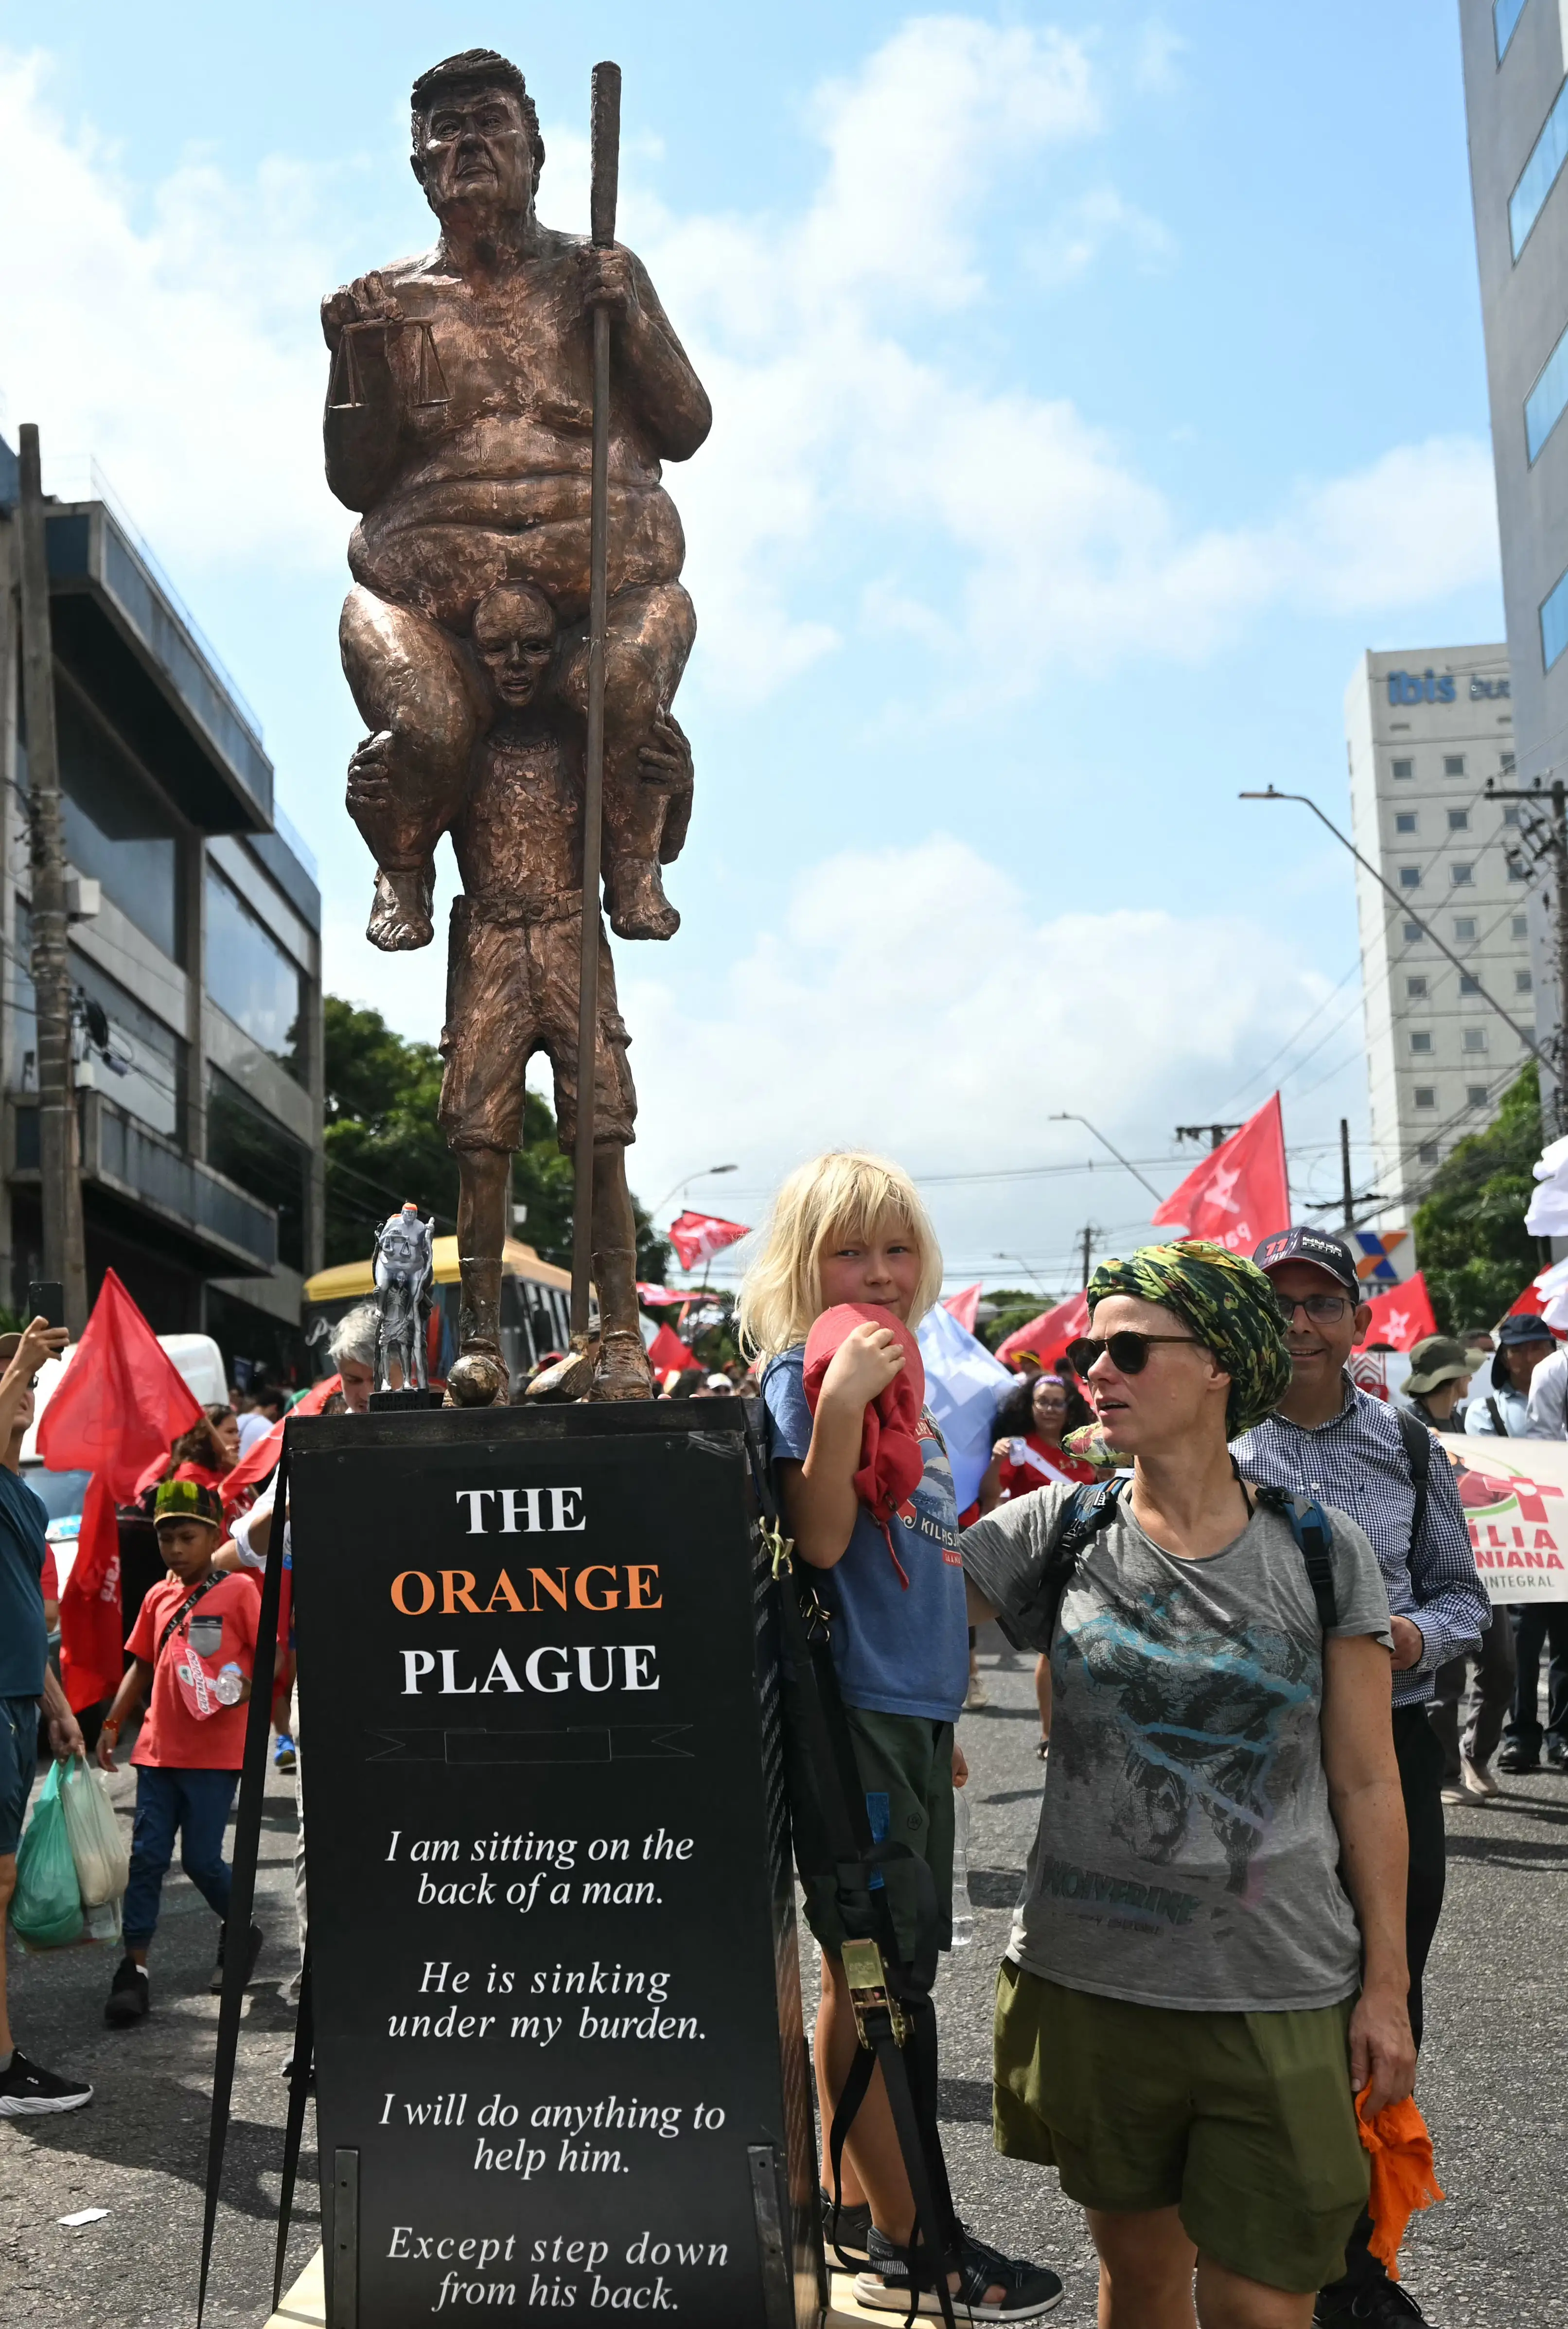
The statue, which stands at more than eight-feet tall, is titled The Orange Plague or The King of Injustice and is the work of Danish sculptor Jens Galschiøt.
Finished in 23-carat gold leaf, the statue has been put on display at the European Parliament in the French city of Strasbourg.
The naked figure is holding an extra-long golf club in one hand and a small set of scales in the other, while a ball, designed to look like the world, lies on the ground in front of him.
Meanwhile, the poor bloke tasked with carrying Trump on his shoulders looks tired and worn out.
A card next to the piece, which is signed The King of Injustice, reads: “I am sitting on the back of a man. He is sinking under my burden. I would do anything to help him. Except stepping down from his back.”
‘The Orange Plague’ was created by Danish sculptor Jens Galschiot (Halil Sagirkaya/Anadolu via Getty Images)
Galschiøt said he created the satirical piece, which was inspired by the old tale of The Emperor’s New Clothes, as a criticism of Trump’s climate policies.
“The sculpture is a satirical out-cry against Trump and the US assault on the green transition and the rule-based world order,” he said.
He said the artwork was not aimed at the parliament itself.
“It is about the attempts by the great powers to dominate, control and reshape the world according to their own interests. Trump is an extreme and very visible symbol of this development,” he said.
“I have made him naked and covered him in gold because sometimes satire can say things that political language cannot.”
The website for the piece states: “The sculpture is inspired by H. C. Andersen’s tale The Emperor’s New Clothes, in which a vain ruler parades naked, believing him-self dressed in the finest garments. The illusion — sustained by fear and flattery — endures until a child cries out, ‘He’s not wearing any clothes’ – and the emperor becomes a figure of ridicule.”
The piece was created as a criticism of Donald Trump’s climate policies (MAURO PIMENTEL/AFP via Getty Images)
Visitors to the statue can also get their hands on their own mini version of the piece, known as ‘protest tokens’, which will be given away for free across the three-day exhibition.
Or if you have access to a 3D printer, you can make your own with the free files available on Galschiøt’s website.
As yet, it’s not known if Trump is aware of The Orange Plague and he hasn’t commented on its existence – but we can probably assume he won’t love it.
However, Per Clausen, the left-wing Danish MEP who invited the artist to display the sculpture, told Deutsche Welle he isn’t worried about any potential backlash from the POTUS.
He said: “If someone is so thin-skinned that they cannot tolerate this sculpture being exhibited in the European Parliament, then they have no place on the world stage.”
Galschiøt said he is ‘very excited’ to see how the exhibition is received by the ‘decision makers of Europe’ during its time on display.
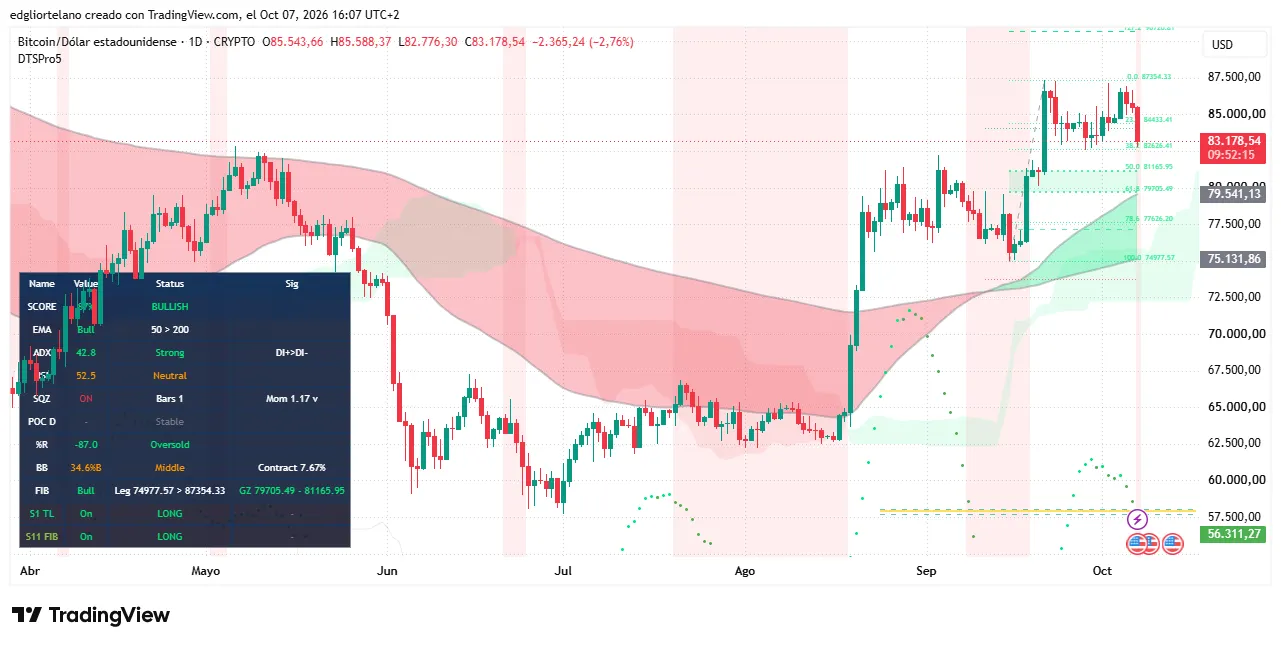
Bitcoin fell as low as $82,776.30 today and sits at $83,178.54, down 2.76% on the day, as oil climbed above $101 and bond yields climbed.
The daily chart still shows a strong trend, but technical indicators show BTC near oversold territory.
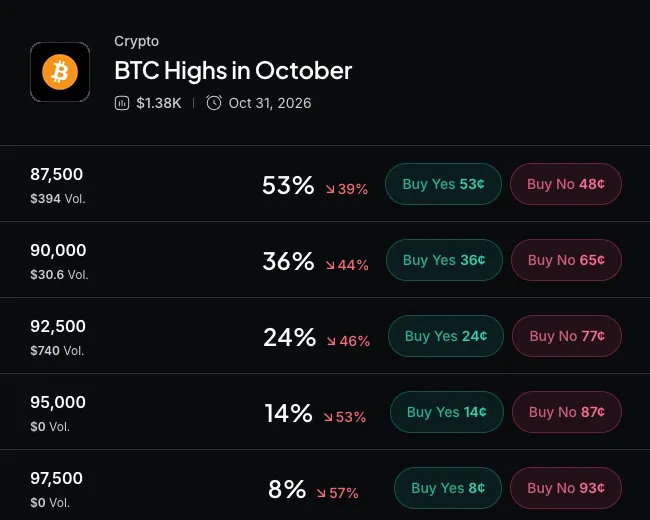
Myriad traders give 67% odds that Bitcoin touches $80,000 in October, and 55% that it touches $87,500.
Bitcoin had a rough morning. It opened today at $85,543.66, slid as low as $82,776.30, and now sits at $83,178.54. The drop appeared to scare off traders as the movement threatened to break a key support as BTC fell sharply within a few hours.
That 3.2% drop left leveraged traders holding the bag. Roughly $969 million in crypto positions were liquidated over the past 24 hours of which $644.47M were long positions, according to CoinGlass.
So what happened, and what comes next? Start with the culprit, because it isn’t just a crypto story.
Stocks slip, oil climbs and bond yields spike
Wall Street is backing off record highs, with the S&P 500 down 0.59% to 7,772.60 and the Nasdaq off 0.71% in morning trading.
The reason is oil. Brent crude is back above $101 a barrel, the 10-year Treasury yield is near 5.34%, and the 30-year hit 5.70%, its highest since 2002. Even gold, the classic safe haven, dropped 1.53% to $4,123.10.
Oil is jumpy because ship attacks in and around the Strait of Hormuz keep piling up. The UK Maritime Trade Operations agency has logged at least one a day in the strait or the Gulf of Aden since October 2, Al Jazeera reports.
On Monday, Iran’s Revolutionary Guard ordered a tanker entering the strait to turn around or risk attack. Pricier oil stokes inflation fears, which push yields up and hurt risk assets like Bitcoin.
BitcoinBTC · USD
$83,252−0.32%
Oct 1Oct 2Oct 4Oct 6Oct 8
$86.8k$85.5k$84.3k$83.0k
24h HighHigh$84,520
24h LowLow$82,823
VolVol$1.8B
Market projectionsOdds by Myriad
→
Oil has bitten Bitcoin before. In June, it sank to $65,590 as Brent climbed to $96 on Middle East tensions. Bitcoin is still about 40% above the roughly $59,500 it traded at in late June.
The Federal Reserve adds to the nerves today with minutes from its September 15-16 meeting, per its calendar.
Bitcoin price: daily bulls, four-hour bears
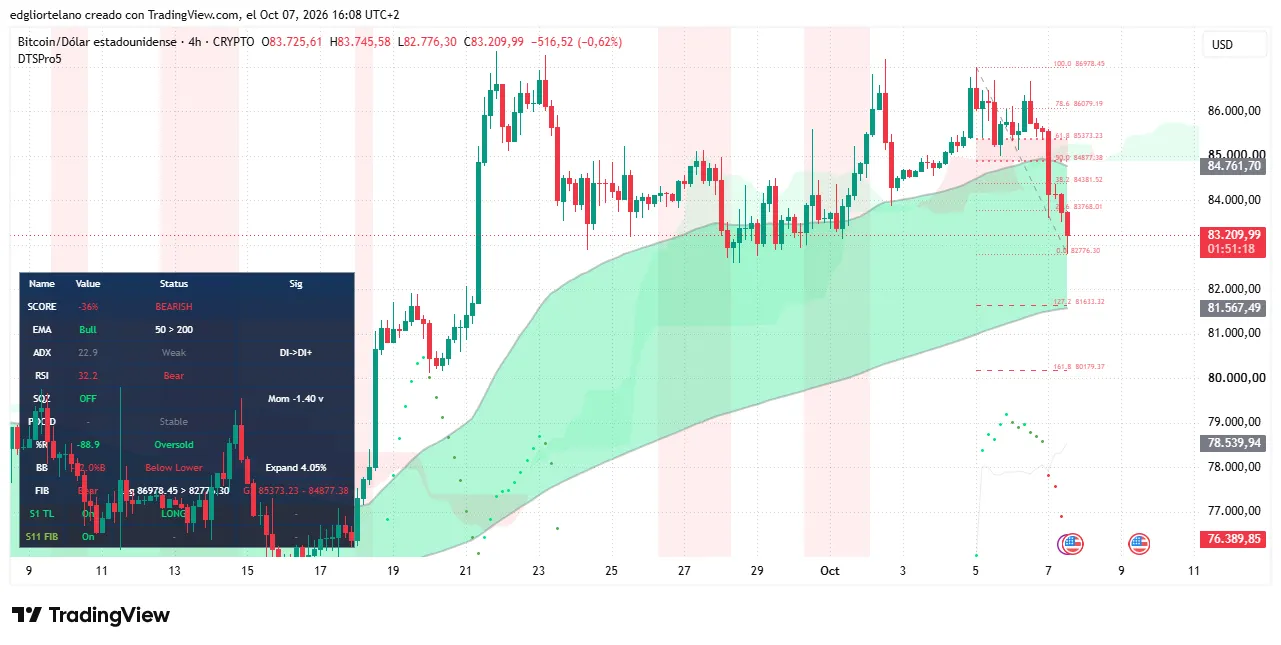
The four-hour chart shows Bitcoin rejected near $86,978.45 before the slide began. The dip took prices below $83,000, when prices bounced, so traders have some reason to breathe.
Bitcoin price data. Image: Tradingview
Fibonacci retracements are lines that mark where a price may pause, based on percentages of a prior move. Measured on that drop, the most relevant levels to watch on the intraday charts sit at $83,768.01 and $84,877.38. Both now act as resistance.
The Relative Strength Index, or RSI, in this short-term, four-hour window measures momentum on a 0-to-100 scale. At 32.2, Bitcoin is clearly oversold as shown by the quick panic attack. On the intraday session, this is a bearish momentum but also where bargain hunters tend to show up, expecting gains on longer time frames.
Zoom out and the daily charts and the Average Directional Index, or ADX, is 42.8, still a strong bullish trend, with buyers still ahead of sellers. The daily RSI in the daily candlestick reads 52.5, neutral, so this sell-off has barely dented momentum on the bigger timeframe.
Bitcoin price data. Image: Tradingview
Exponential moving averages, or EMAs, track average price over a set window while weighting recent prices more. The 50-day EMA remains above the 200-day on both the daily and four-hour charts, which typically means the broader uptrend hasn’t broken. The daily squeeze is still on, with a momentum reading of 1.17 that is slipping, meaning volatility remains compressed.
The daily low of $82,776.30 also stopped about $150 above the Fibonacci retracement around the $82,626.41 price line.
As oil and yields rose, stocks, gold and Bitcoin sold off together, which suggests this isn’t a crypto-specific problem.
So, macro lit the fuse, but leverage fed the fire. When price falls, exchanges force-close leveraged positions that can no longer cover their losses. Those forced sales push the price lower still.
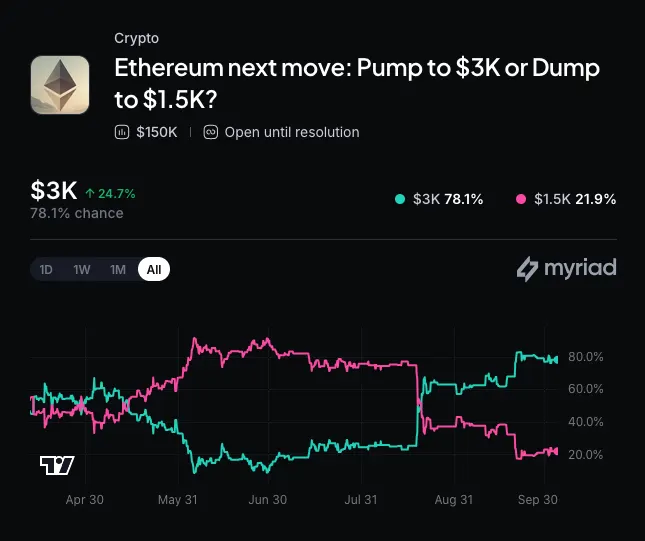
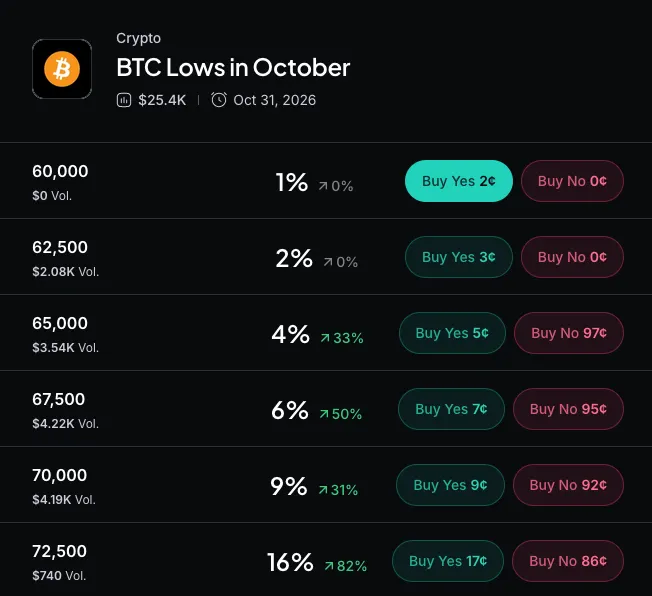
Traders on Myriad, a prediction market developed by Decrypt’s parent company Dastan, are already pricing in more pain. As of this writing, the BTC lows in October market gives 92% odds that Bitcoin touches $82,500 this month, 67% for $80,000 and 43% for $77,500.
Upside bets are cooler. The BTC highs in October market has 55% odds on a touch of $87,500 and 36% on $90,000. Both markets pay out on Binance touches, not closes, so a drop and a rally can both resolve “yes” in the same month.
Bulls need to retake $84,761.70, the top of the four-hour trend band, and then the $84,877.38 retracement to argue the dip is over. If $82,776.30 gives way, the next stops are the four-hour band bottom at $81,567.49 and the daily 50% retracement at $81,165.95. The Fed minutes and any new Hormuz headlines are the catalysts to watch.
Disclaimer
The views and opinions expressed by the author are for informational purposes only and do not constitute financial, investment, or other advice.
Daily Debrief Newsletter
Start every day with the top news stories right now, plus original features, a podcast, videos and more.