Critics would argue that three past instances aren’t enough to draw a definite conclusion. While that is true, the contrarian record of the bear cross is consistent with the reputation of ultra-long-duration moving averages as “lagging” indicators.
Backward looking
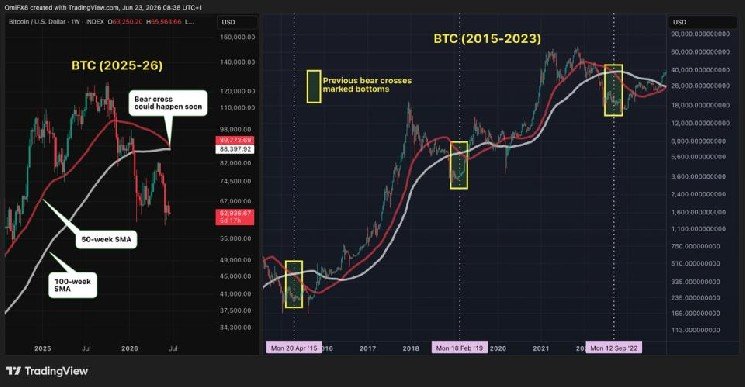
Think about the information the averages are conveying. They represent the average price over the previous 50 and 100 weeks. In other words, they reflect price action that has already materialized. The imminent bear cross is essentially a reflection of the 50% drop in bitcoin price from $126,000 in October to nearly $60,000. It has limited predictive power at best.
By the time these bear crosses finally occur, the market froth is usually gone, short-term speculators have exited and capitulation has already taken place. Taken together, this suggests traders are likely to treat the intersection as a serious signal that might just mark a bottom once again.
Of course, past patterns offer no guarantee of future results, and shifts in the wider economy can single-handedly make or break technical trends. Because of this, factors like bond yields, ETF flows and the latest actions from Strategy (MSTR) remain as critical as ever in determining bitcoin’s next move.
As of the time of writing, bitcoin traded near $62,400, with the 50-week average at $89,771 and the 100-week average at $88,397.
Leave a Reply