Ripple ($XRP) remains under pressure on Tuesday as uncertainty across the broader cryptocurrency market and weak technical momentum weigh on the altcoin.
$XRP has slipped below the key $1.00 level. Mixed derivatives and on-chain indicators point to cautious sentiment, leaving $XRP at risk of additional losses.
Derivatives traders maintain bearish bias
CoinGlass data shows that the long-to-short ratio for $XRP stands at 0.92, near its lowest levels in a month.
A reading below one means short positions outnumber long positions, indicating that more traders are betting on prices falling than rising.
The ratios therefore reflect a bearish tilt across the derivatives markets of $XRP. The funding rates also support the current bearish narrative.
$XRP’s funding rate turned negative on Tuesday and currently reads -0.0021%, after hitting 0.0055% on Monday.
A negative funding rate means traders holding short positions are paying those with long exposure, signalling a bearish positioning bias despite some potential for a short squeeze.
CryptoQuant’s indicators suggest cautious optimism for $XRP but a weaker outlook for XLM.
$XRP’s futures market has recorded large whale orders, while most other indicators remain neutral.
This could support a recovery if larger investors continue building positions and market conditions improve.
$XRP’s bearish performance over the past 24 hours comes despite South Korea’s Jeonbuk Bank announcing a partnership with blockchain payments company Ripple to deploy its cross-border payment system for business customers.
As part of the agreement, the Ripple Payments platform would let the bank’s customers settle overseas transfers in seconds to minutes, with operations around the clock.
The service targets businesses including import-export companies, technology startups and online content creators.
$XRP price outlook: Token loses key $1 support
$XRP is down by roughly 1% in the last 24 hours and trades around $0.99 on Tuesday, maintaining a bearish short-term outlook after slipping below the psychological $1.00 level and its descending trendline.
The token also remains below its major daily Exponential Moving Averages.
The 50-day EMA stands at $1.07, the 100-day EMA at $1.15, and the 200-day EMA at $1.34. These indicators now form several layers of overhead resistance.
Momentum indicators reinforce the downside risk. The Relative Strength Index is near 43, reflecting weak buying momentum without yet reaching oversold territory.
The Moving Average Convergence Divergence indicator is also slightly negative, pointing to lingering bearish pressure rather than an established reversal.
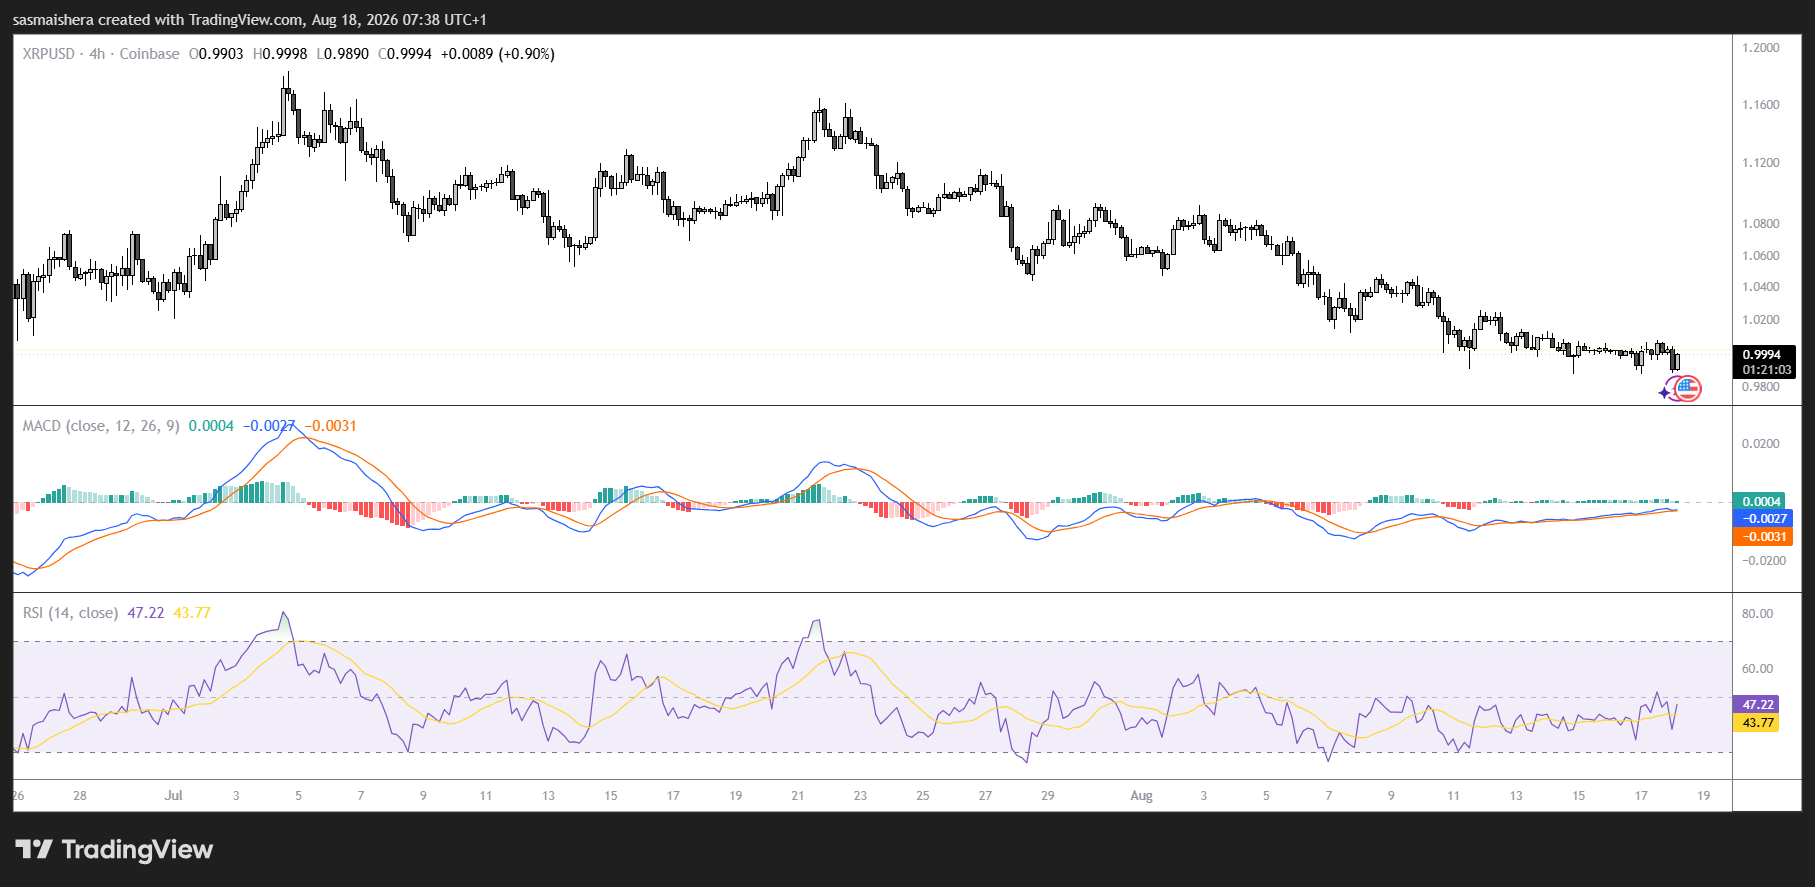
For a recovery, $XRP must first reclaim and hold above $1.00. A successful move could bring the 50-day EMA at $1.07 into focus, followed by the 100-day EMA at $1.15 and horizontal resistance at $1.30.
The 200-day EMA at $1.34 and the higher resistance level at $1.90 represent more distant upside targets.
No clear support level is defined immediately below $XRP’s current price, leaving the token vulnerable to further price discovery if demand does not return around the $1.00 region.
Leave a Reply