
Despite a sharp rebound above the daily pivot, Nakamoto Stock (NAKA) remains in a bearish regime. The bounce looks tactical, not structural, as trend damage persists and oversold conditions fuel a durability debate.
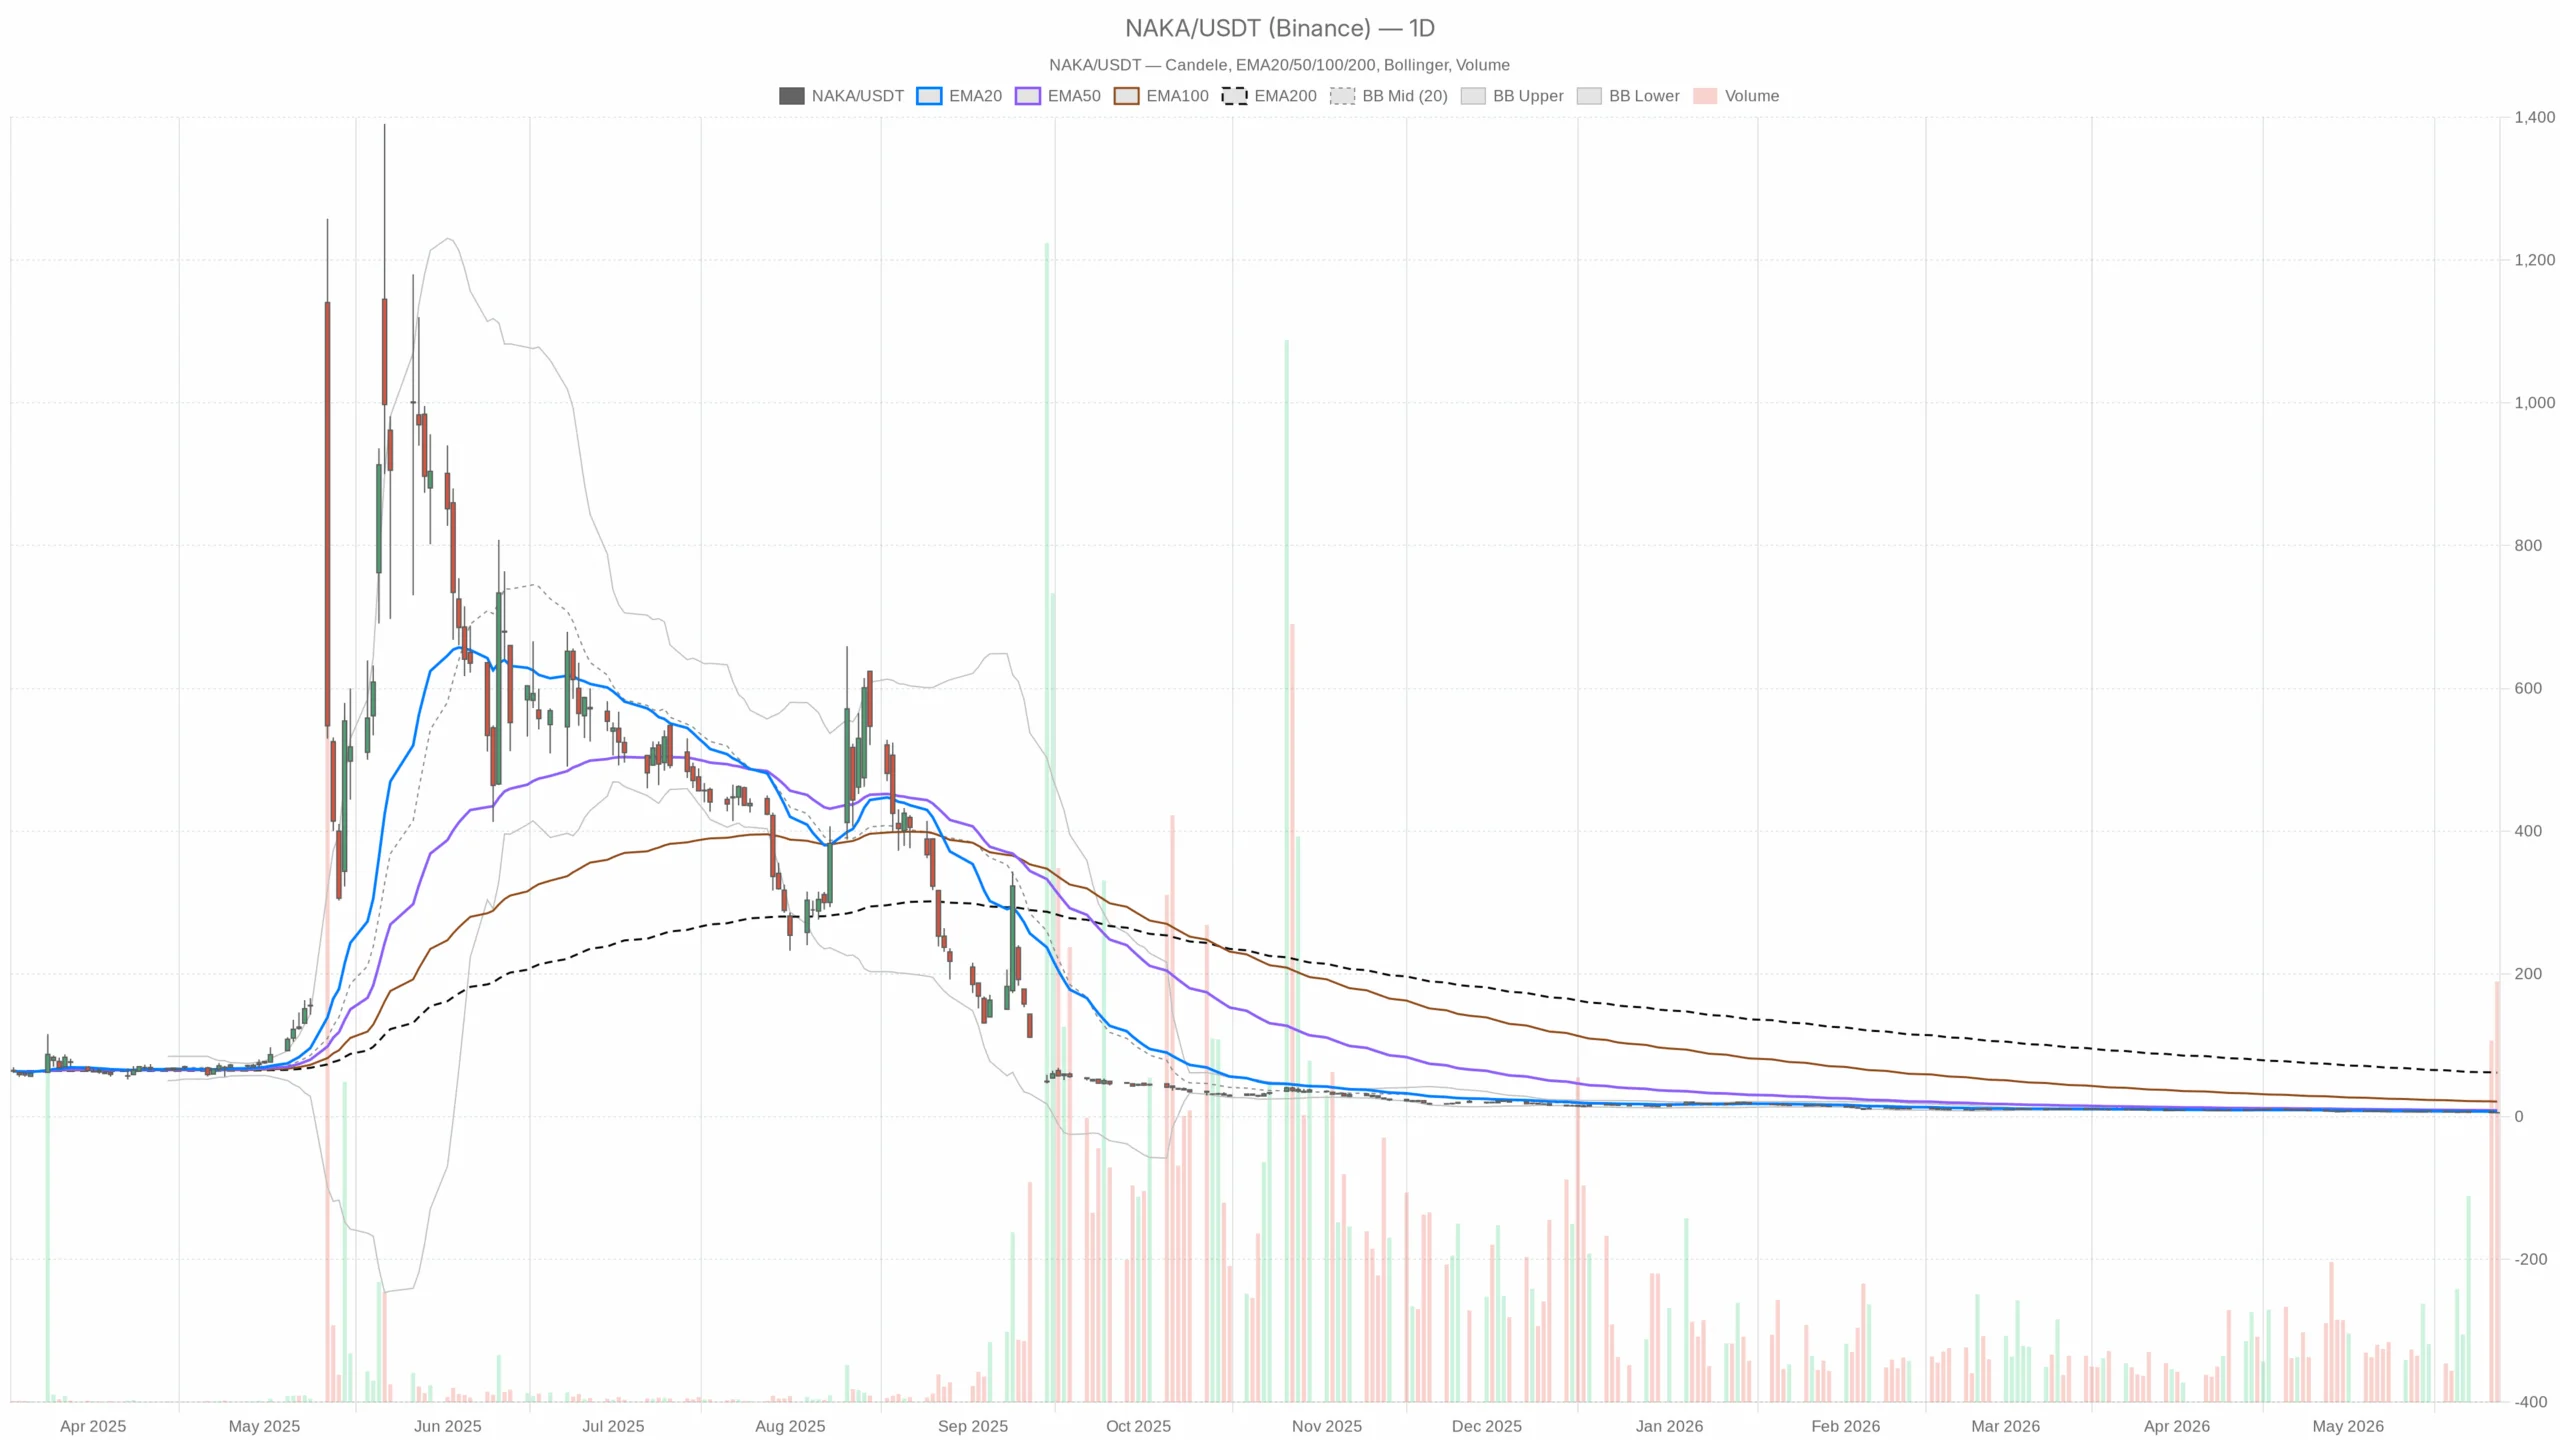
Nakamoto Stock Overview: Bearish Trend Intact
The dominant downtrend remains the governing context. Any strength still reads as a countertrend move rather than the start of a base.
Daily Chart: Oversold Stretch in a Mature Downtrend
On the daily timeframe, price closed at 5.40, far below the EMA20 7.03, EMA50 8.71, and EMA200 61.47. Trading beneath all key moving averages confirms a mature downtrend.
Momentum and Volatility
Daily RSI14 33.38 signals weak momentum, near but not at capitulation. The MACD shows a line at -0.69 versus a -0.60 signal, with a -0.09 histogram. Momentum stays negative; however, the smaller histogram hints at marginally easing pressure. ATR14 0.90 keeps volatility elevated and swings wide.
Pivots, Bands, and Levels
Daily Bollinger Bands place the mid at 7.00 and the lower band at 5.68, with price closing at 5.40. A finish below the lower band flags an oversold stretch with bounce risk. Meanwhile, the daily pivot sits at 5.12 (R1 5.74, S1 4.78). Price sits back above the pivot, which suggests short‑term stabilization, yet nearby resistance looms.
1-Hour Chart: Stabilizing but Still Down
On the 1-hour chart, price at 5.42 remains below the H1 EMA20 5.64, EMA50 6.20, and EMA200 7.35. Intraday trend is still down, and rallies should meet supply near these averages.
H1 RSI14 42.76 is weak but off the lows. The MACD line at -0.44 trails the -0.38 signal with a -0.07 histogram, keeping downside momentum intact, though not accelerating. Meanwhile, the Bollinger mid sits at 5.88 with price below it, and ATR14 0.41 implies sizable, whipsaw-prone ranges.
The H1 pivot is 5.31 (R1 5.54, S1 5.18). Price holds above the pivot, so the intraday tone is stabilizing; however, resistance sits close overhead.
15-Minute Chart: Bounce Shows Overextension Risk
On M15, price is above the EMA20 5.02 and EMA50 5.36 but still below the EMA200 6.20. Very short-term momentum has flipped up, yet the broader intraday cap remains.
M15 RSI14 63.31 shows buyers in near-term control and entering a warm zone. The MACD line at -0.03 is above the -0.16 signal with a +0.13 histogram, turning execution-time momentum positive.
However, the M15 Bollinger upper band is 5.32 with price near 5.42. Trading above the band flags overextension into nearby resistance. The M15 pivot is 5.38 (R1 5.47, S1 5.32), with price holding above the pivot and first resistance close at 5.47.
Headlines and Sentiment Overhang for Nakamoto Stock
Notably, headlines add a sentiment headwind. A planned 1‑for‑40 stock split to reduce share count and pursue Nasdaq compliance after a 99% slide underscores balance‑sheet optics rather than operating momentum. Separately, governance noise around a Chief Medical Officer at a bitcoin treasury company down over 99% keeps credibility in focus. This backdrop can cap rallies.
Scenarios for NAKA: Bullish vs. Bearish Paths
Therefore, the main scenario stays bearish on the daily timeframe. Price below all major EMAs, sub‑35 RSI, and a negative MACD keep lower highs and lower lows as the default path. The bias favors sellers unless key resistance is reclaimed.
Bullish Validation Triggers
For a bullish scenario, buyers must convert the oversold stretch into a sustained basing bounce. A daily close back inside the Bollinger envelope above roughly 5.68 and a push through the daily R1 5.74 would be the first tell. On H1, reclaiming the EMA20 5.64 and then the EMA50 6.20 would add confirmation. A follow‑through toward the daily EMA20 7.03 would strengthen the case.
Bearish Continuation Triggers
In contrast, the bearish continuation strengthens if stabilization fails near intraday pivots. Losing the H1 pivot zone at 5.31 and especially S1 5.18 would put the daily S1 4.78 back in play. With daily ATR14 0.90, ranges are wide; a move into the mid‑4s can arrive quickly if selling resumes. A rollover on M15 from 5.47 resistance back below the 5.38 pivot would offer early evidence.
Bottom Line: Bias Remains Lower
Overall, Nakamoto Stock sits in a bearish trend with a live, oversold bounce that the hourly chart only weakly supports. Position sizing should respect elevated ATR‑driven volatility, while timing should acknowledge the short‑term stretch on the 15‑minute chart. Until the reclaim thresholds are met, NAKA remains sell‑biased with rallies likely facing supply.
Leave a Reply