
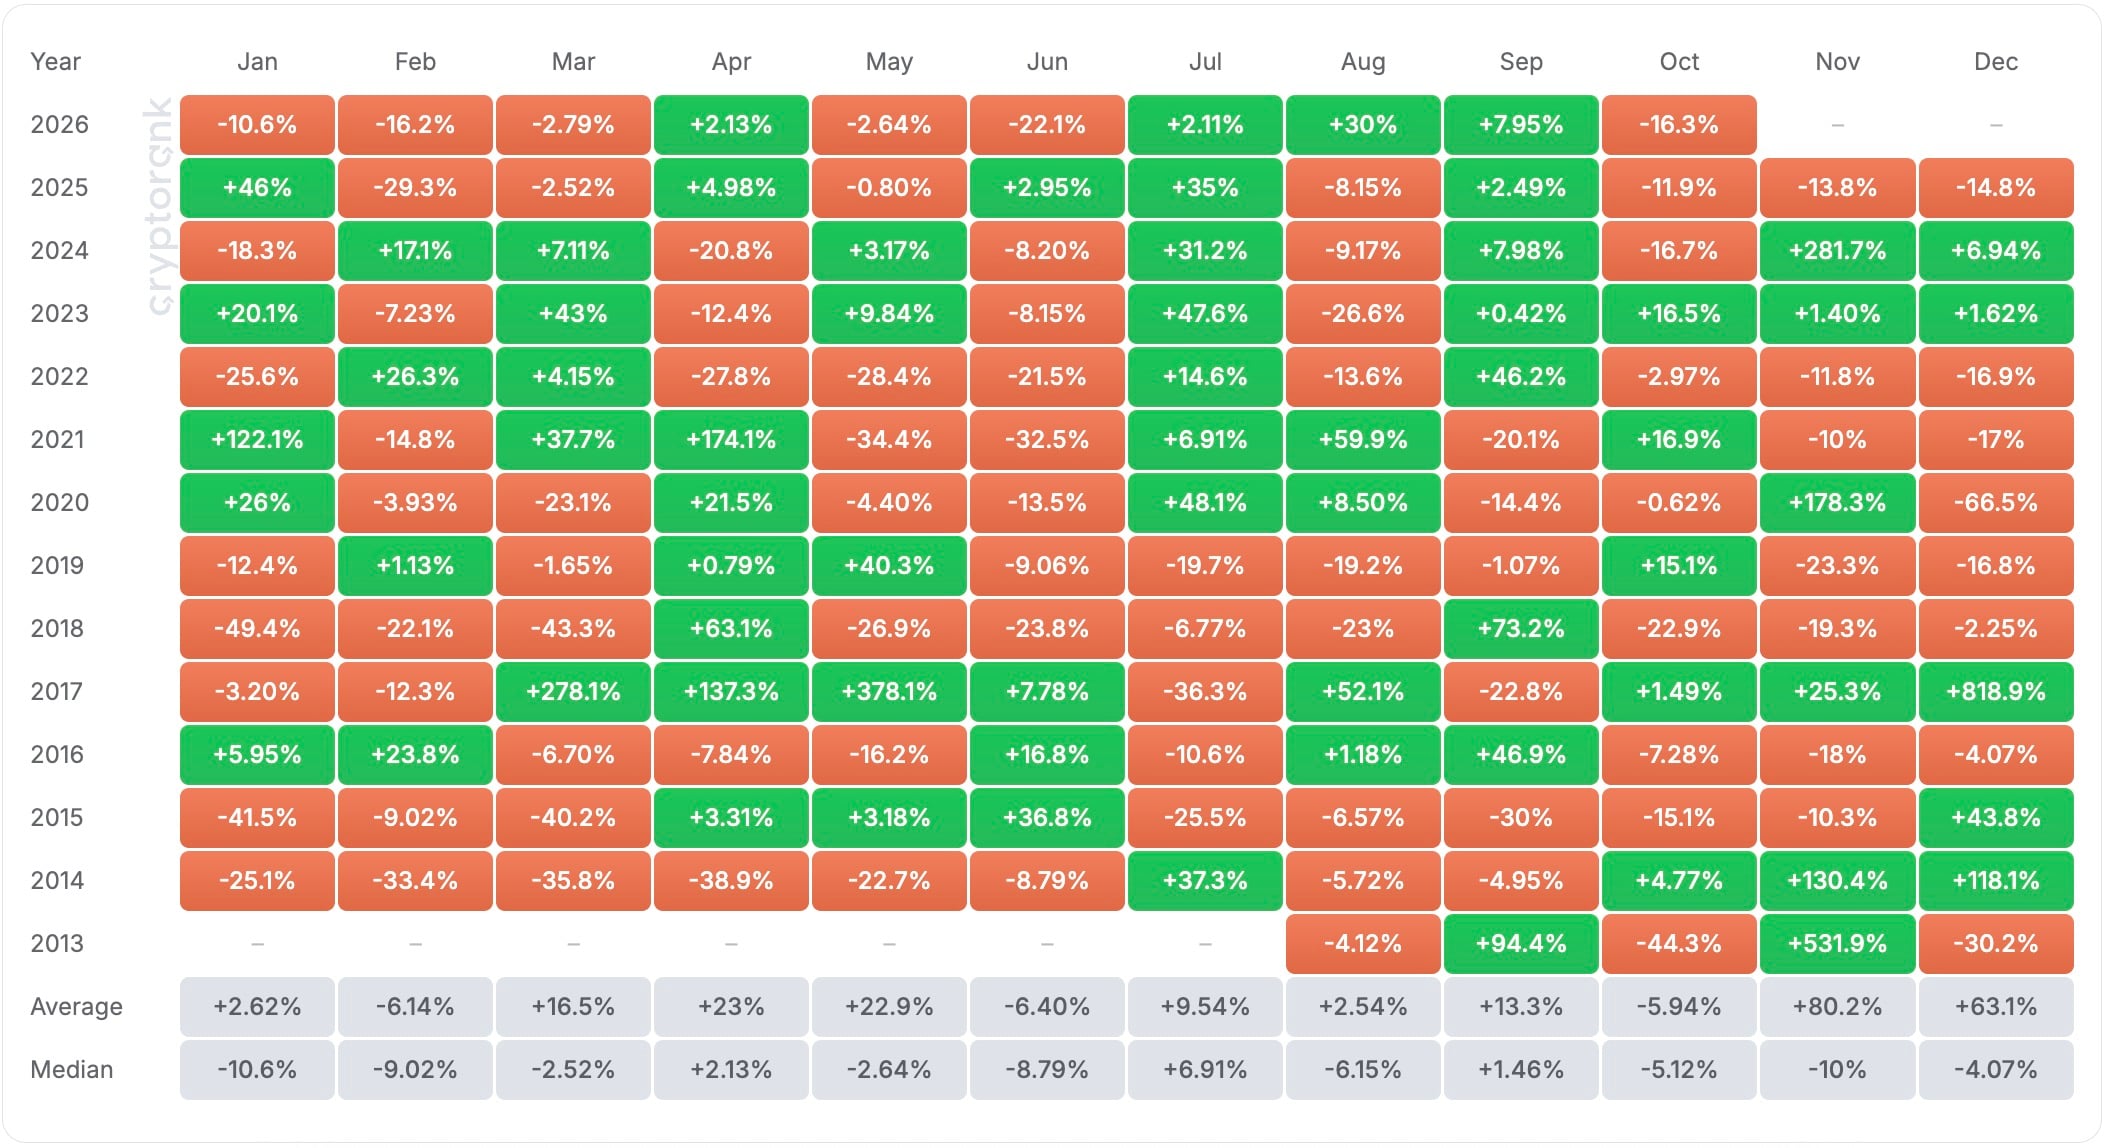
The median is not a perfect guide either: thirteen observations are a small sample, and the market structure has changed. Since spot $XRP ETFs launched in the US in mid-November 2025, the token has had an institutional demand channel that did not exist in earlier cycles.
Mathematical pessimism is reinforced by the real balance of power on the market at the end of October. The $XRP price has fallen below the key support line of $1.30 and is trading around $1.25–$1.26, marking a local downtrend.
All the upward momentum built on investors’ expectations has faded, opening the way for profit-taking by short-term players. Notably, the October decline follows a 48% gain in the third quarter, $XRP‘s best Q3 in four years, which suggests that at least part of the current pressure is profit-taking after the rally rather than seasonality alone.
The situation is aggravated by an inevitable influx of supply amid a liquidity shortage. On Sunday, November 1, a scheduled unlock of 1 billion $XRP from Ripple’s escrow wallets will take place.
It is worth noting, however, that the escrow unlock is a routine monthly event that has followed the same schedule since 2017, and Ripple typically returns 600–800 million $XRP to new escrow contracts. The real net addition to circulating supply is therefore closer to 200–400 million $XRP.
Even so, against the backdrop of thin liquidity, this volume is enough to put additional pressure on the price, as it will enter the market simultaneously with macroeconomic pressure and the aftermath of the recent wave of forced liquidations of long positions worth more than $1.29 billion, caused by a security incident at the Binance exchange.
At the same time, the wave of liquidations has partially cleared excess leverage from the market. If funding rates stay negative and open interest does not recover, the bearish scenario may be capped by a short squeeze, which would make a retest of $1.30–$1.32 more likely than the statistics suggest.
The chart, cleared of historical anomalies, points to two scenarios:
- The downward vector: a breakdown of the $1.20–$1.17 zone opens a direct path to the psychological mark of $1.00 and the local low of $0.98.
- To return to bullish dynamics, buyers need to bring quotes back above the $1.30–$1.32 range, followed by consolidation at the weekly close.
Leave a Reply