Toncoin’s explosive rally in early May has largely given way to consolidation, leaving the market focused on whether buyers can regain momentum. After surging from roughly $1.40 to a peak near $2.91, the token entered a broad corrective phase as profit-taking steadily absorbed momentum.
Yet the decline never developed into a full structural breakdown. Instead, sellers repeatedly stalled near the $1.69–$1.80 demand zone, allowing buyers to establish a series of higher lows into late May.
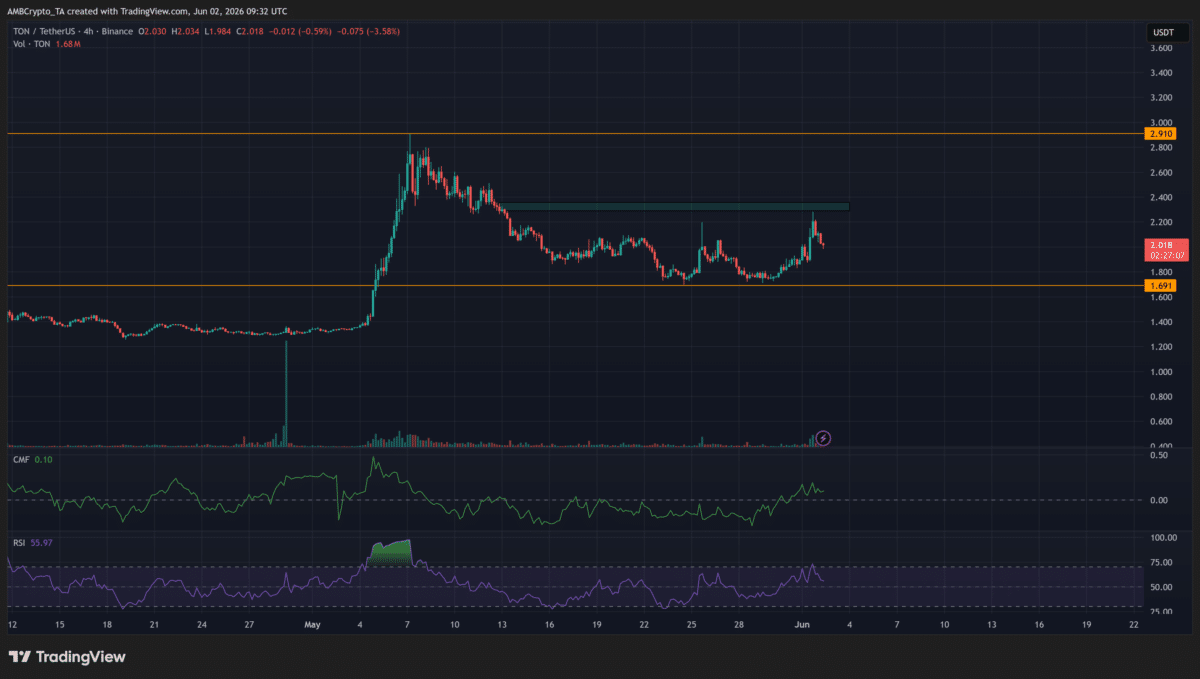
That shift gradually pushed $TON back above $2.00 and toward the $2.40 supply region. The current pullback from that area suggests sellers remain active, though they have yet to reclaim control fully.
If buyers convert $2.20–$2.40 into support, $TON could reopen a path toward the $2.91 high.
Can $TON reclaim $2.28?
$TON’s corrective phase appears to be approaching a resolution point as the price continues trading between the $1.69 support zone and the $2.28 resistance region.
Since rebounding from support, buyers have repeatedly attempted to rebuild momentum, yet each advance has stalled before reclaiming overhead supply.
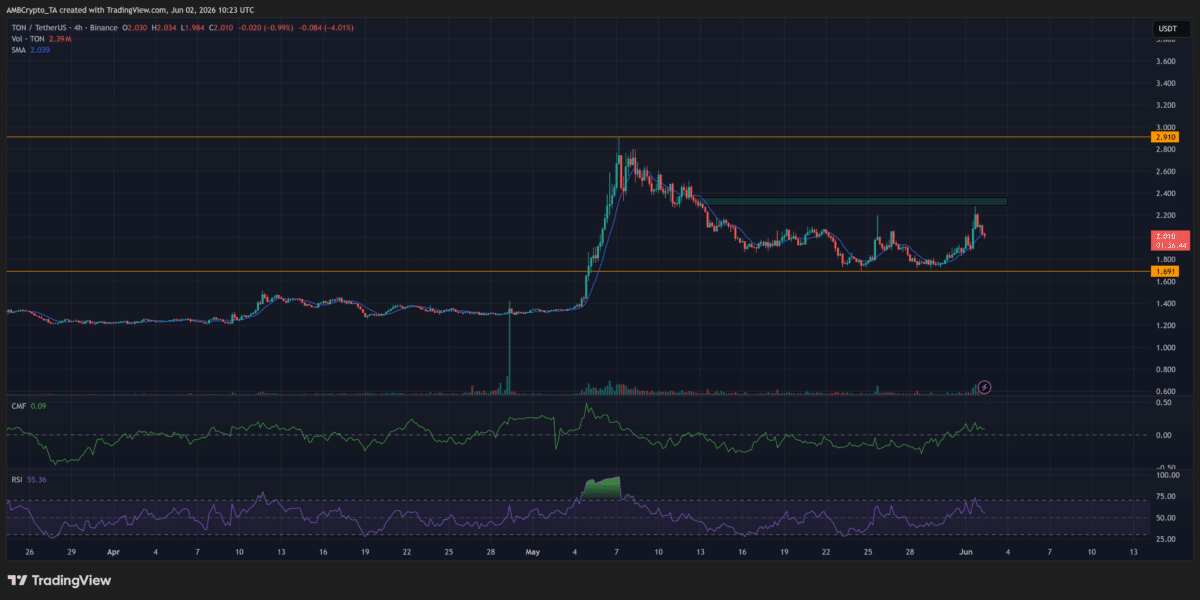
That behavior suggests demand remains strong enough to prevent a breakdown, though not yet strong enough to restart the broader uptrend. This implies that the market has entered a period of compression where both buyers and sellers continue defending their respective levels.
Such structures rarely persist indefinitely. If buyers absorb the remaining supply around $2.28, $TON could accelerate toward $2.50 and eventually retest the $2.91 high. However, another rejection would likely extend consolidation as traders await a stronger catalyst to drive the next directional move.
The bullish case above $2.28
While $TON remains confined below the $2.28 resistance zone, the repeated recovery attempts carry an important implication. Despite several rejections, sellers have failed to force the price back toward the critical $1.69 support area, suggesting buying pressure continues rebuilding beneath the surface.

This gradual shift matters because prolonged consolidation often serves as a battleground where supply is absorbed before the next directional move emerges.
If buyers eventually reclaim $2.28, the market would move beyond merely defending support and begin challenging overhead supply. In that scenario, $TON could advance toward the $2.50–$2.60 region, where prior distribution activity occurred during the May correction.
A successful reclaim there would place the $2.91 high back within reach and strengthen the case for a broader trend continuation.
Final Summary
- Toncoin [$TON] continues defending its higher-low structure, keeping the broader recovery scenario intact despite prolonged consolidation.
- $TON could regain bullish momentum if buyers reclaim $2.28 and convert resistance into support.